This project will focus on comparing sensitivity thresholds, noise characteristics, detector response, and background rates between real and simulated ProtoDUNE-HD data, focusing particularly on Argon-39. The student will have an opportunity to gain insights into the detection principles of Liquid Argon Time Projection Chambers and develop key skills in data handling, statistical analysis, and simulation techniques using programming languages such as C++, Python, and ROOT to carry out their analyses and simulations.
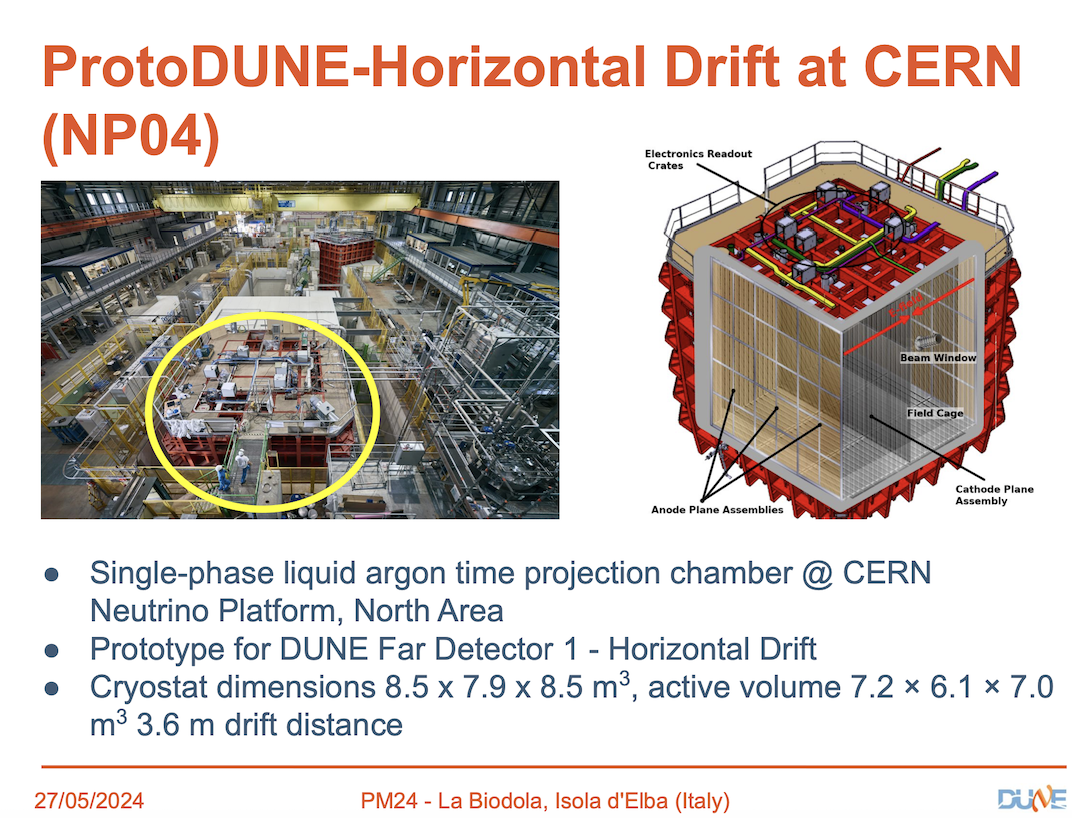
The ProtoDUNE-HD detector comprises a 8.5 x 7.9 x 8.5 m^3 cryostat. The cryostat is spanned by alternating arrays of high-voltage cathode and low-voltage anode planes, where each anode-cathode pair defines a single LArTPC drift volume (with a drift length of 3.6 m.). The detector volume is filled with liquid argon, which serves as the active target medium for particle interactions.
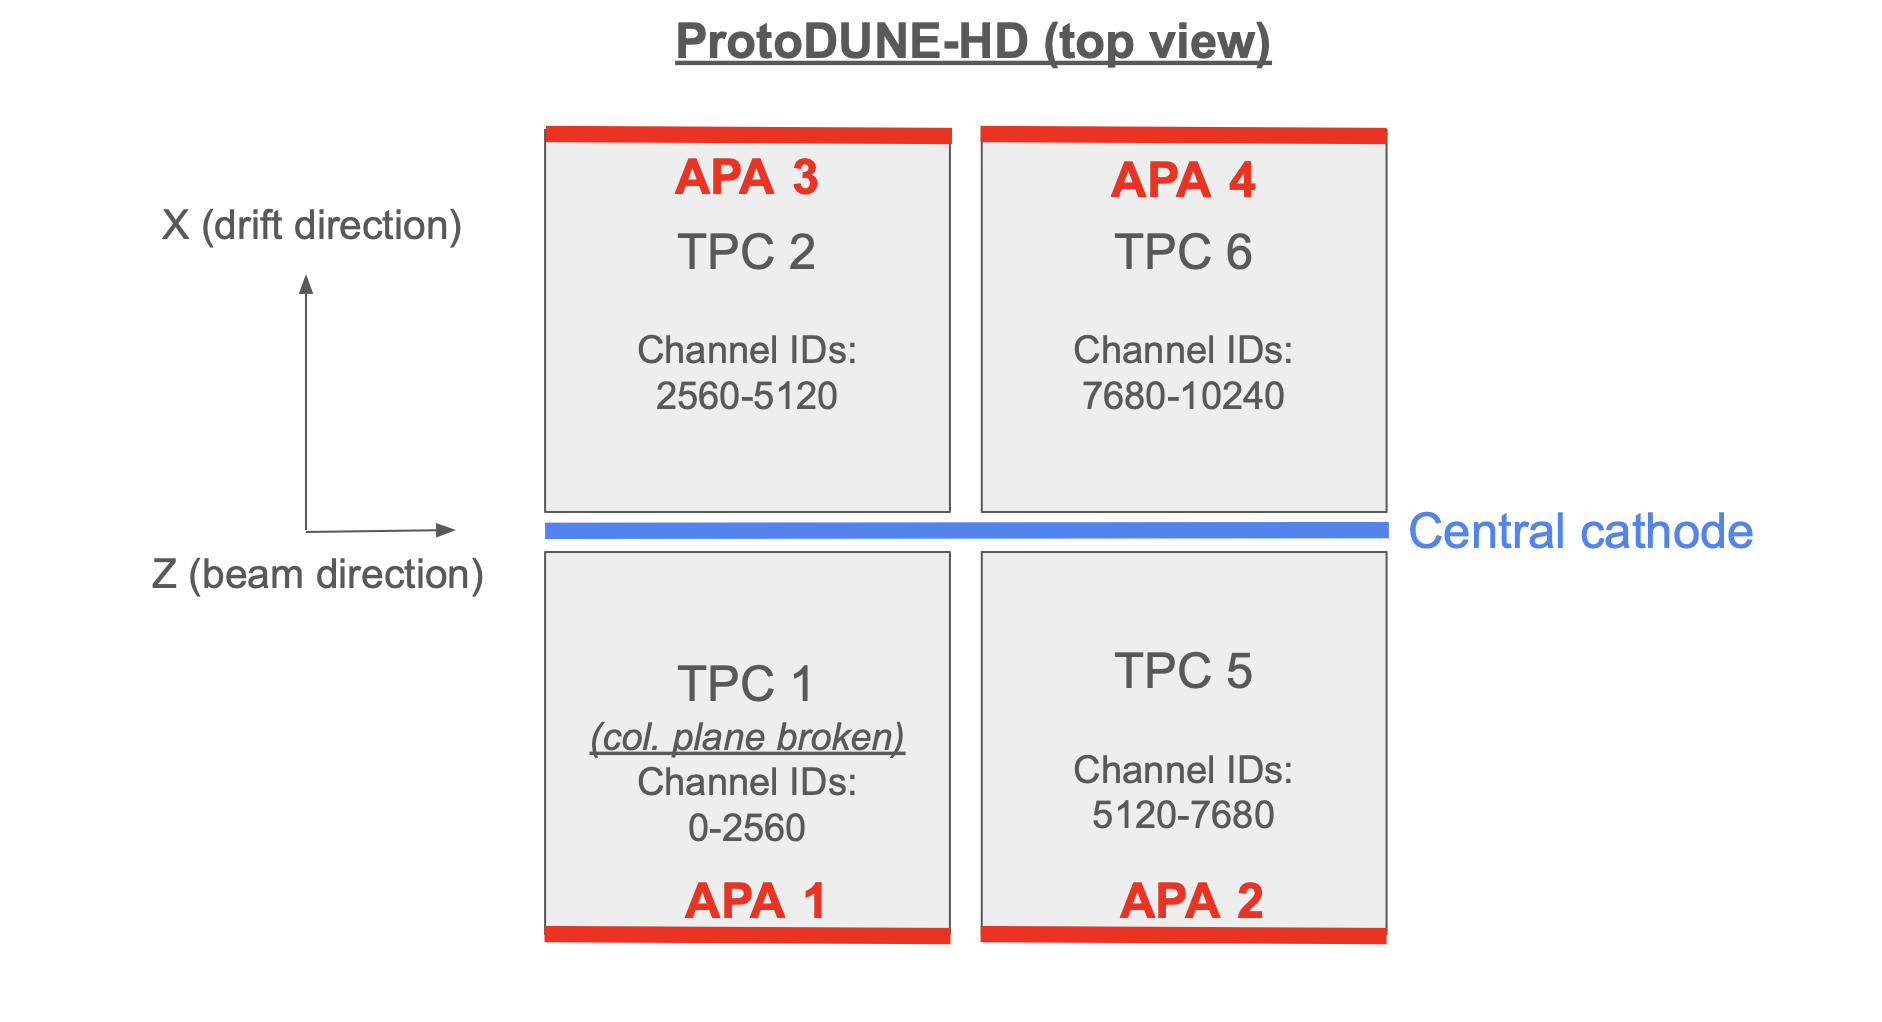
The PDHD detector includes four APAs arranged in two rows on either side of the beamline, creating four LArTPC drift volumes. Each APA has four wire planes on both sides, totaling 2,560 active channels: one collection plane with 960 vertical wires per side, and two induction planes with 800 angled wires per plane that wrap around both sides of the APA.
In line with the usual DUNE convention, the coordinate system is defined in such a way that the z-axis is alinged with the beam direction, x-axis is algined with the drift direciton, and y-axis is aligned with the vertical (upwards) direction.
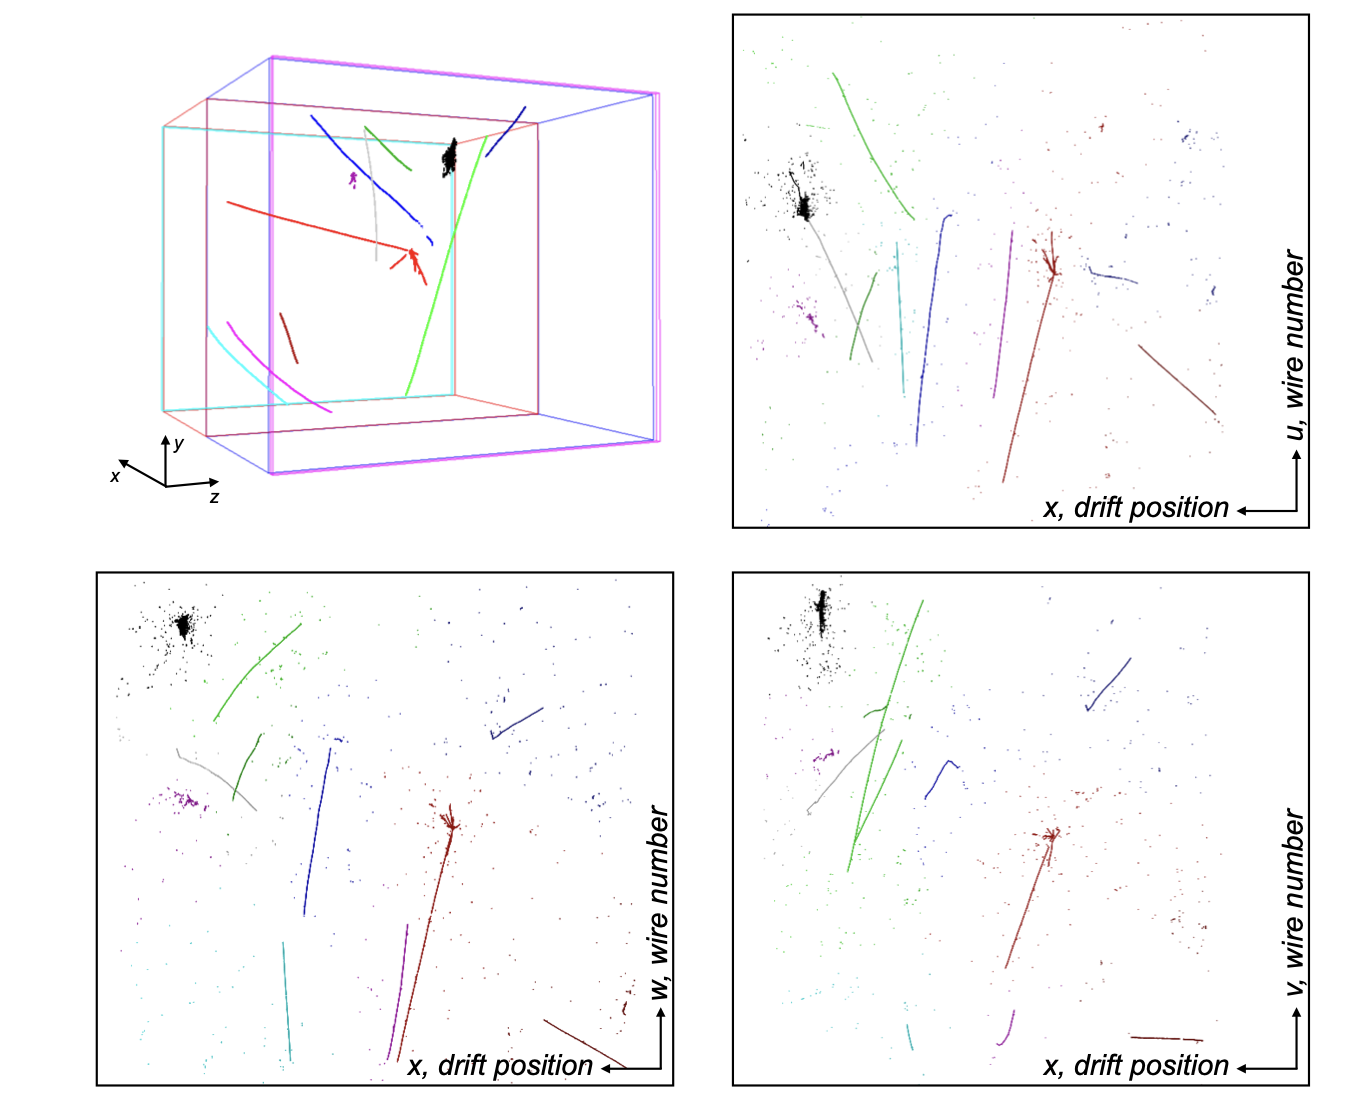
The data consists of simulated as well as real cosmic data from the PDHD detector. As the cosmics travel through the active volume of the detector, they leave behind an ionization track. The ionization electrons from that track are drifted towards the APA planes on either side the detector where the signal can be readout using the detector electronics.
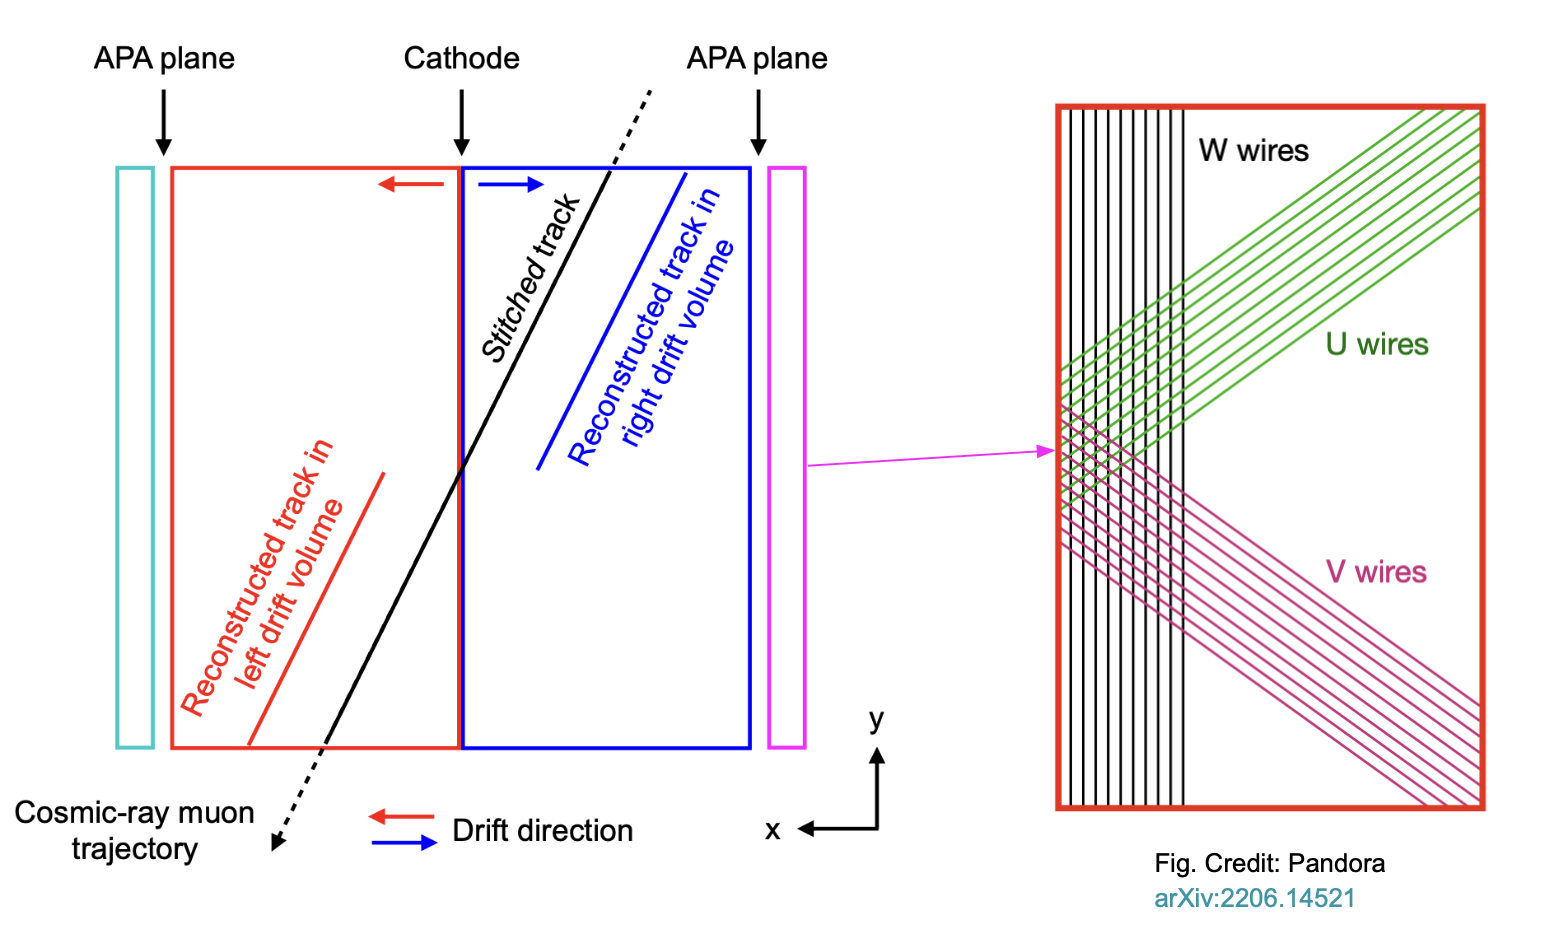
Additionally, each wire plane is oriented at a different angle, allowing for precise 3D imaging of the event when combined with drift time information.
The charge collected by the sense wires is digitized by cold electronics mounted at the top of the detector. The data is read out as ADC waveforms, with signals appearing as time pulses on individual channels. A signal is defined as any ADC pulse that exceeds a pre-set threshold, which is typically based on the detector's noise conditions. For downstream analysis, these pulses are converted into "hits"—data structures that summarize key information about the pulse, such as its start and stop times, duration, and peak ADC value.
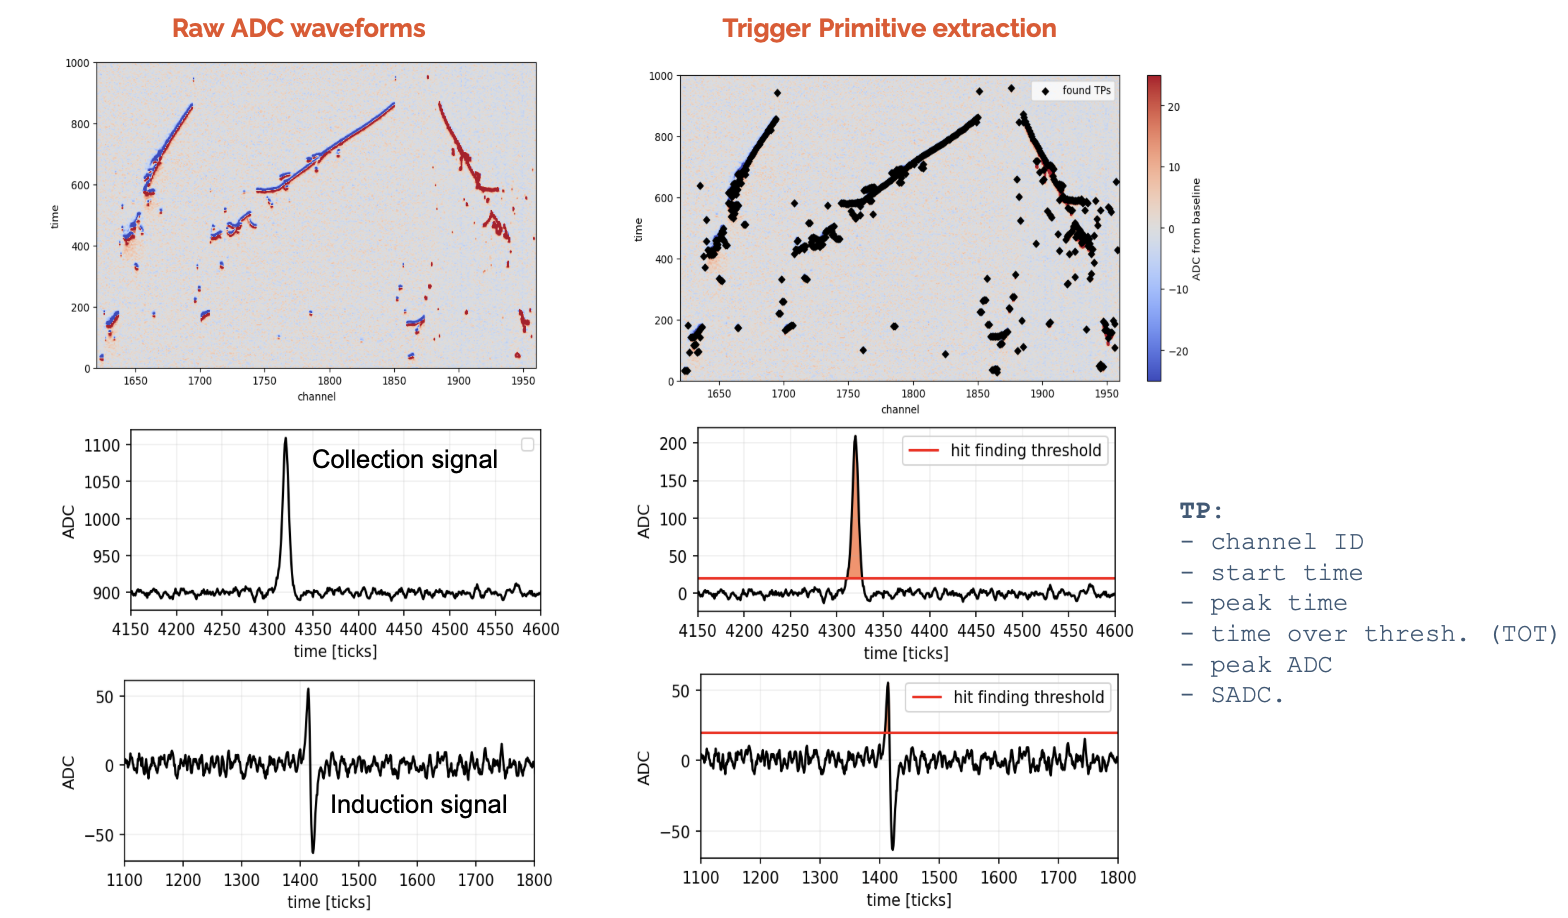
Trigger Primitives are a data object used online which is an equivalent of the hits used in the offline reconstruction. The main difference is that trigger primitives extract information directly from raw data, while offline, the waveforms undergo various signal processing steps such as 2D deconvolution, in-depth noise filtering, charge calibration etc. before hits are extracted. As such trigger primtivies are only a rough approximation of the offline hits.
The Trigger Primitive object contains the following information:
| Field | Description |
|---|---|
time_start |
Time when signal first went above threshold |
time_peak |
Time at which the peak ADC value of the signal occurs |
time_over_threshold |
Number of time ticks the signal was over threshold |
channel |
The channel on which the signal was detected |
adc_integral/SADC |
Sum of ADC values (ADC * tick) while signal is over threshold |
adc_peak |
Peak ADC value of the ADC signal |
The above information should be sufficient to summarise the location and signal shape characteristics of any activity within the detector.
You can find the data to be used in the analysis here: CERNBOX
The GitHub page contains an example Notebook which shows you how to load and process the data. Note that you can use whatever data analysis approach you're most comfortable with (whether it is ROOT, python, jupyter etc.), just remember to try and keep track of your progress (you can start by forking this repo!).