


An end-to-end Business Intelligence workforce analytics project demonstrating how multiple HRMS data sources can be consolidated, transformed, and analysed using Power Query, SQL, and Power BI to deliver workforce insights across headcount, attrition, hiring trends, workforce costs, and planning metrics.
HR teams often manage employee information across multiple systems, making it difficult to create a single source of truth for workforce reporting.
This project simulates a real-world HR analytics scenario where two separate HRMS files are consolidated into one master workforce dataset to support data-driven decision-making.
The dashboard helps HR stakeholders monitor:
- Workforce size and composition
- Active vs terminated employees
- Attrition trends
- Hiring patterns
- Workforce cost and budget variance
- Future workforce planning insights
Source: Synthetic HRMS datasets created for portfolio demonstration.
No real employee data was used.
hrms_a.csv               HRMS source file A
hrms_b.csv               HRMS source file B
cleaned_master_data.csv  Final consolidated workforce dataset
The dataset includes:
- Employee demographics
- Department information
- Employment status
- Salary and workforce cost data
- Hiring and termination records
- Department-level workforce metrics
- Power BI – Data modeling, DAX measures, dashboard development
- Power Query – Data extraction, transformation, cleaning, and consolidation
- SQL (SQLite) – Workforce analysis, KPI calculation, trend analysis
- Excel / CSV – Source data management
- Git & GitHub – Version control and documentation
HRMS Source File A + HRMS Source File B
                    ↓
        Power Query Data Transformation
                    ↓
   Standardisation, Cleaning & Data Validation
                    ↓
             Master Workforce Dataset
                    ↓
              SQL Analysis Layer
                    ↓
        DAX Measures & KPI Calculations
                    ↓
             Power BI Dashboard
                    ↓
        Workforce Insights & Decisions
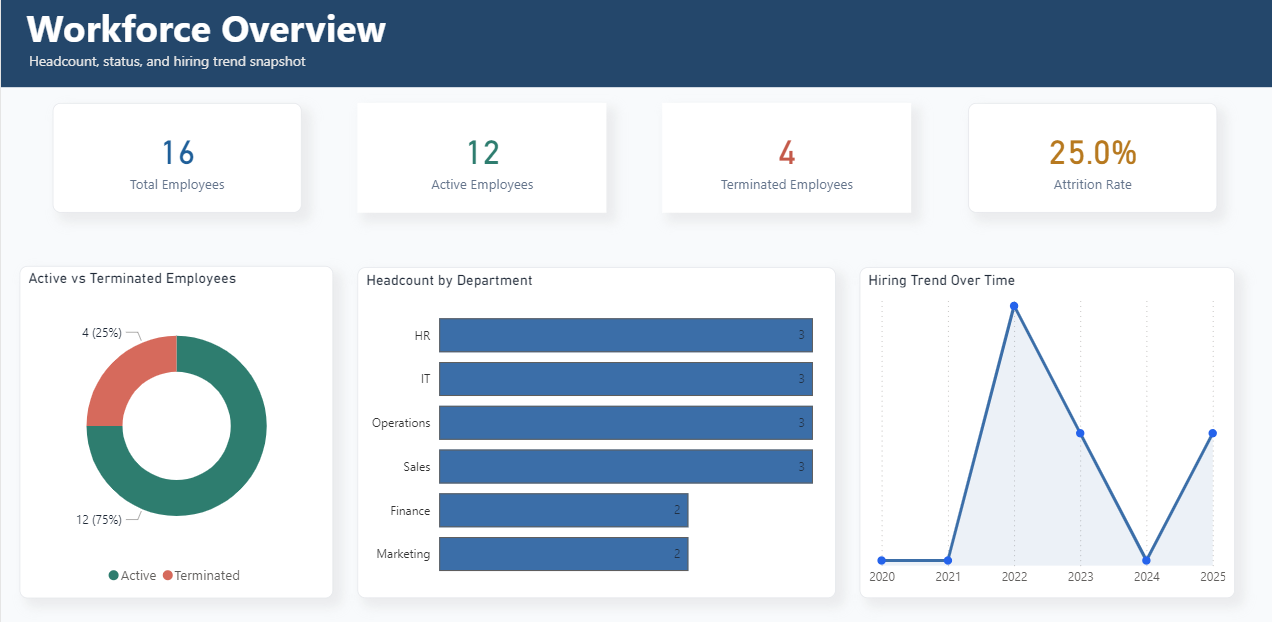
Provides a high-level workforce summary including:
- Total headcount
- Active vs terminated employees
- Department distribution
- Hiring trends
- Workforce composition
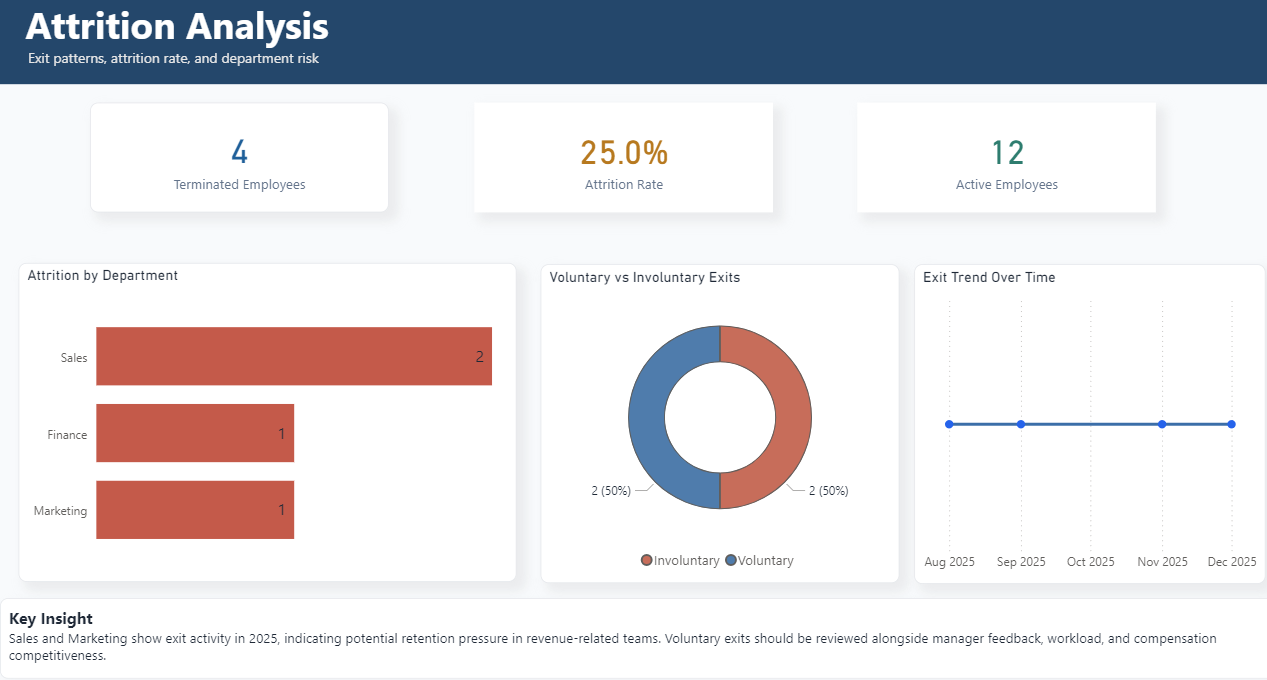
Analyses employee turnover patterns including:
- Overall attrition rate
- Voluntary vs involuntary exits
- Department-level attrition
- Exit trends over time
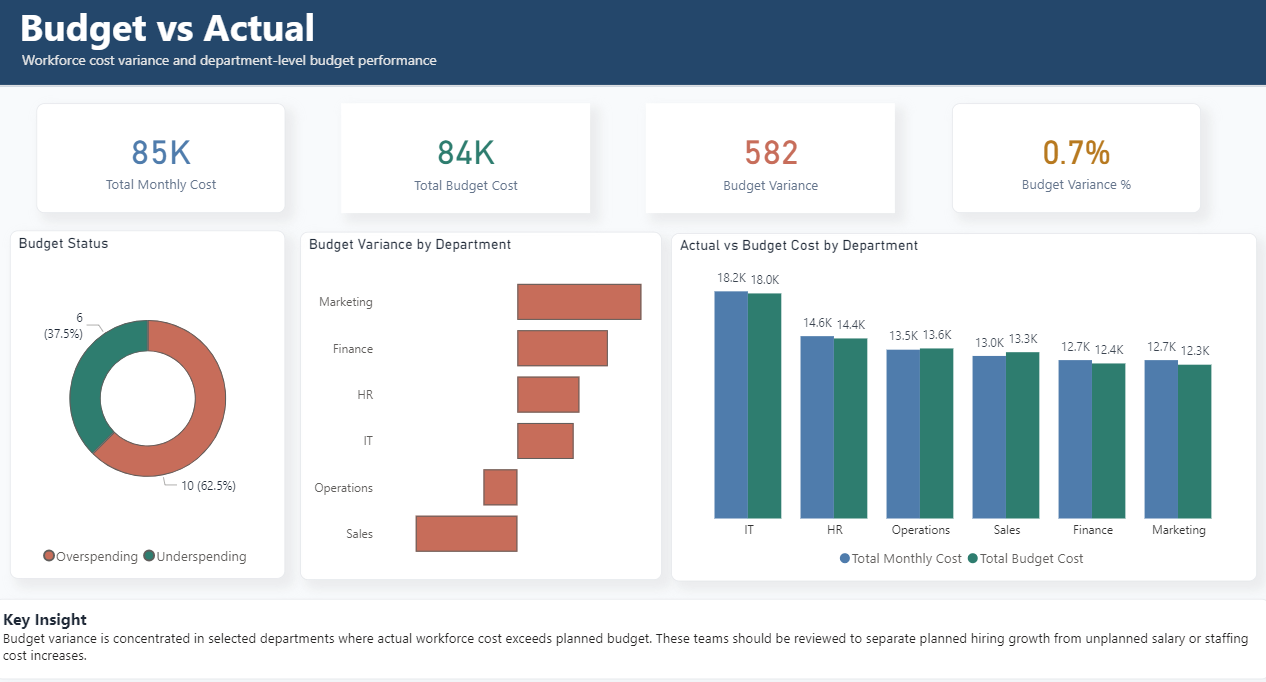
Evaluates workforce cost performance:
- Actual workforce cost
- Planned budget
- Budget variance
- Department-level cost comparison
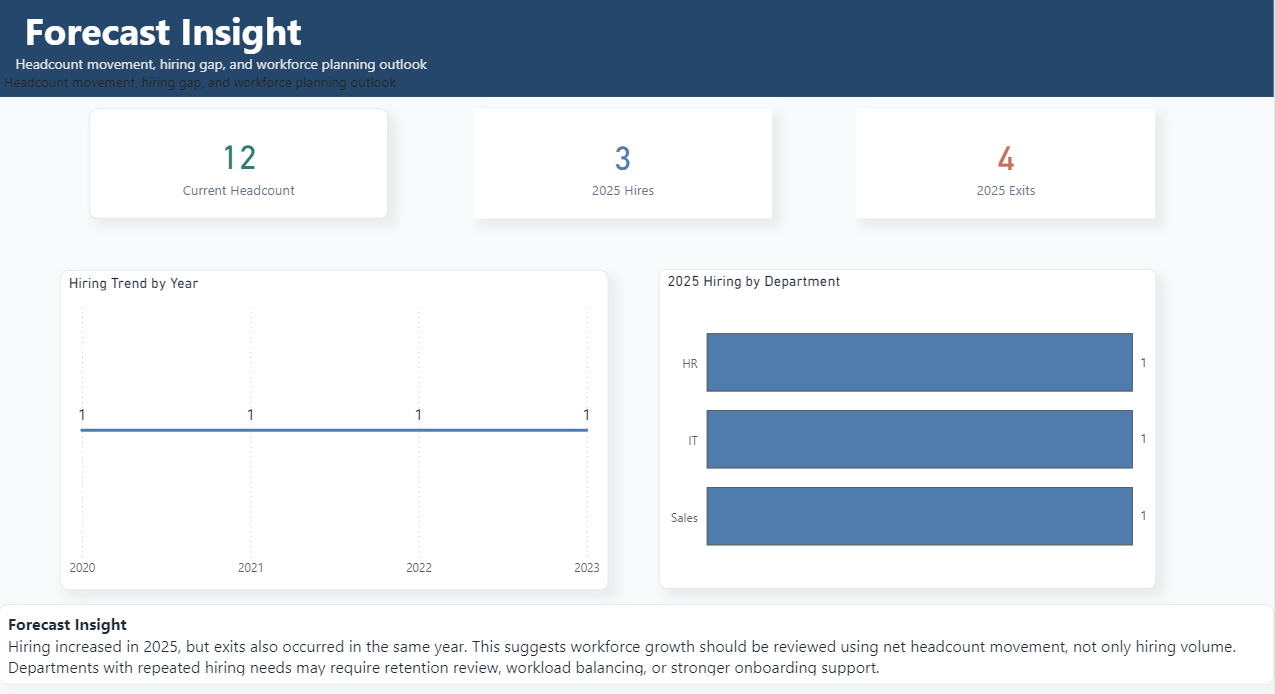
Supports workforce planning through:
- Hiring movement analysis
- Exit trends
- Workforce changes over time
- Future planning indicators
- Analysed workforce composition across departments to identify employee distribution patterns and workforce structure.
- Identified departments with higher employee turnover trends, helping highlight potential retention risks.
- Compared actual workforce costs against planned budgets to identify cost variance and support financial planning.
- Analysed hiring and termination patterns to provide visibility into workforce movement and future staffing needs.
Performed data preparation steps including:
- Loaded and combined multiple HRMS source files
- Standardised column names across datasets
- Cleaned employee ID formats into consistent standards
- Converted hire and termination dates into proper date formats
- Standardised department naming conventions
- Removed duplicate employee records
- Converted salary and cost fields into numeric formats
- Created employee status classification:
- Active
- Terminated
- Generated a consolidated master workforce dataset
SQL was used to perform workforce analysis and KPI calculations.
| SQL Technique | Application |
|---|---|
| Window Functions | Salary ranking by department |
| Running Totals | Cumulative hiring and exit trends |
| Moving Averages | Workforce trend analysis |
| Time-Series Analysis | Monthly workforce movement |
| Variance Analysis | Budget vs actual workforce cost |
| Cohort Analysis | Hiring and exit patterns by year |
The Power BI data model uses the cleaned master workforce dataset to support:
- Employee-level analysis
- Department-level reporting
- Workforce cost analysis
- Attrition tracking
- Hiring trend analysis
Relationships and calculated measures were created using Power BI data modeling and DAX.
- KPI Dashboard Development
- Workforce Reporting
- Executive Reporting
- Data Visualization
- Business Insights Generation
- Data Cleaning
- Data Validation
- Data Consolidation
- Trend Analysis
- Workforce Analytics
- Attrition Analysis
- Power BI
- Power Query
- DAX
- SQL
- SQLite
- Excel / CSV
- Connect to cloud-based HR data warehouse
- Automate scheduled HR reporting refreshes
- Add predictive attrition modelling
- Implement employee segmentation analysis
- Create automated executive reporting packs
Joyce Lee How Yee
PL-300 Certified Business Intelligence & Data Analyst with experience in People Analytics, HR reporting, Power BI, SQL, Python, and data visualization. Passionate about transforming complex data into actionable business insights.
Currently open to:
- Business Intelligence Analyst roles
- Data Analyst roles
- People Analytics roles
- Reporting Analyst roles
📎 LinkedIn: https://www.linkedin.com/in/joyceleehowyee/
📎 GitHub Portfolio: https://github.com/joyceleehy