This utility is intended to be a visual tool for designing image grids, layouts, or galleries by taking the guess work out of color science.
To begin, first pre-populate the ./images directory with your available pool of images. Alternatively,
you can symlink an existing collection of images into the project directory, however you'll need to ensure that
the resulting link is named accordingly (images).
Afterwards, simply run php scan.php to generate the required images.json file. The scan script will
run through the images directory and create a JSON file containing an array of supported image file names. This file
will ultimately be used to determine availability and calculate averages.
The last step is to programmatically design your board / layout. Within the index.js file, you'll find
an onLoad() action. Within this event, you can place highlighted images at specific index positions along your grid,
and the engine will automatically interpolate between your listings based on the available pool of images.
Additionally, you can exclude images for discovery if - for example - you decide that you no longer want
to include one, or you just aren't totally satisfied with the placement after seeing the layout in its entirety.
A basic usage example is outlined ahead.
Layout.setOnLoad(() => {
    Layout.addExclusions([
        './images/dont-want-1.jpg',
        './images/dont-want-2.jpg',
    ]).addListings([
        new Listing(0, Layout.getImageByPath('./images/first.jpg')),
        new Listing(10, Layout.getImageByPath('./images/second.jpg')),
        new Listing(20, Layout.getImageByPath('./images/third.jpg')),
    ]).interpolate();
});
In this example, we have three featured images, each spaced 10 images apart from one another. The engine will run through these listings and interpolate between them based on the nearest perceived color distance to each interpolated step. For different grid sized, simply adjust the CSS to account for more (or less) columns as necessary.
This utility makes use of a JS build process through webpack. After updating your highlight listings within the
index.js file, you can kick off the build process using either npm run start or npm run watch via the project
directory.
To access and preview the resulting grid content, it is highly advised to use a local server solution rather than
modifying any of your browser's security / CORS settings to access these images. My recommendation would be to use
python -m SimpleHTTPServer 8000 if available, and access the end result via the browser at localhost:8000
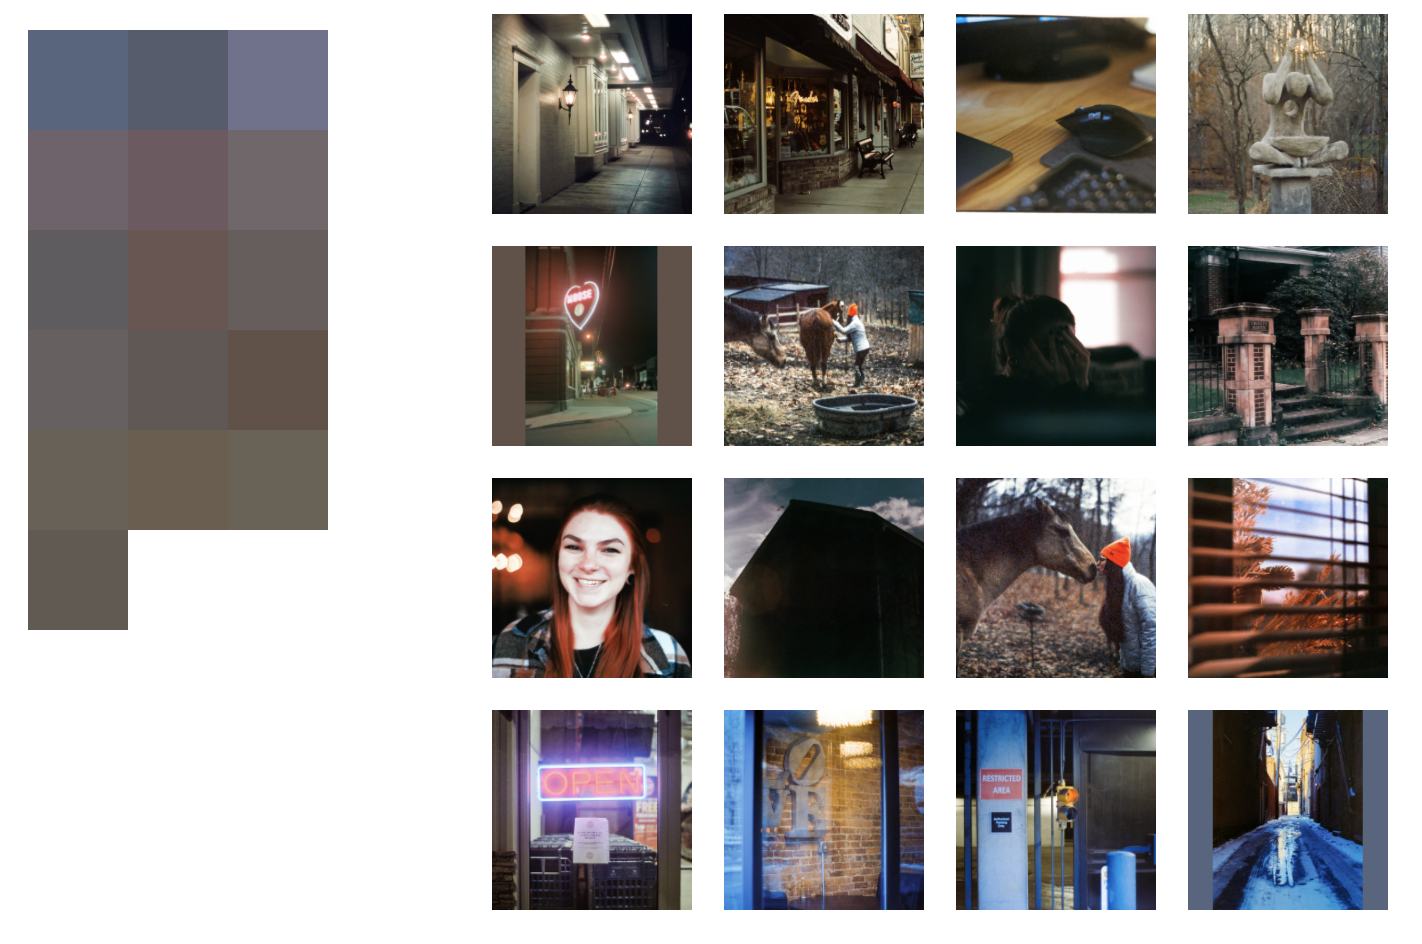
The following screenshot shows off a preview of the end result. On the left is the raw color data extracted from each of the corresponding images along the right, however one thing to note is that the generated visualizations are actually inverted from one another (ie. top left on the block grid is actually reflecting the bottom right image).