


SigNoz is an open-source observability platform built on OpenTelemetry. We’re building an enterprise-grade alternative to fragmented monitoring stacks, with logs, metrics, traces, alerts, and dashboards in one place.
Fully managed SigNoz with a 30-day free trial, no credit card required, usage-based pricing that starts at $49, and regional data hosting.
Enterprise Cloud, BYOC, or Enterprise Self-Hosted with compliance, support, custom retention, RBAC, ingestion controls, data residency, and region selection.
Free open-source SigNoz that runs in your own infrastructure. Deploy with Docker, Kubernetes, or Linux and keep full control of your data plane.
SigNoz helps teams debug production issues faster by connecting logs, metrics, traces, alerts, dashboards, exceptions, and agent-native workflows in one place.
Monitor service latency, error rate, throughput, Apdex, top endpoints, database calls, and external calls.
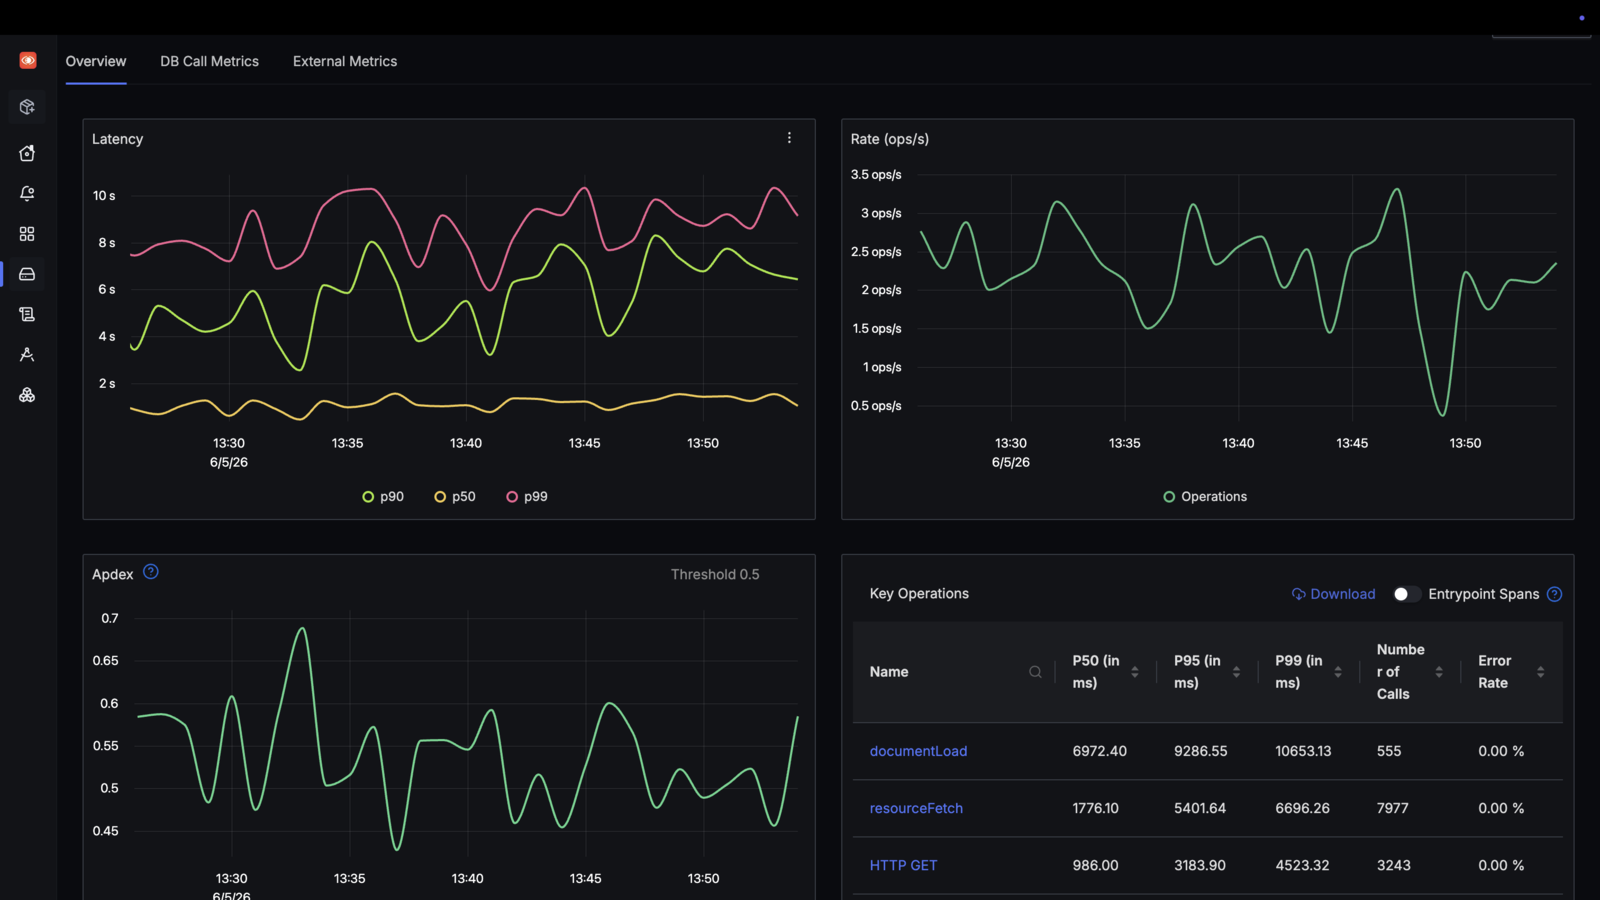
Learn more: APM documentation
Ingest, search, aggregate, and correlate logs with traces and metrics using a visual query builder.

Learn more: Log management documentation
Build dashboards for application, infrastructure, and custom metrics using Query Builder, PromQL, or ClickHouse SQL.
Learn more: Metrics documentation
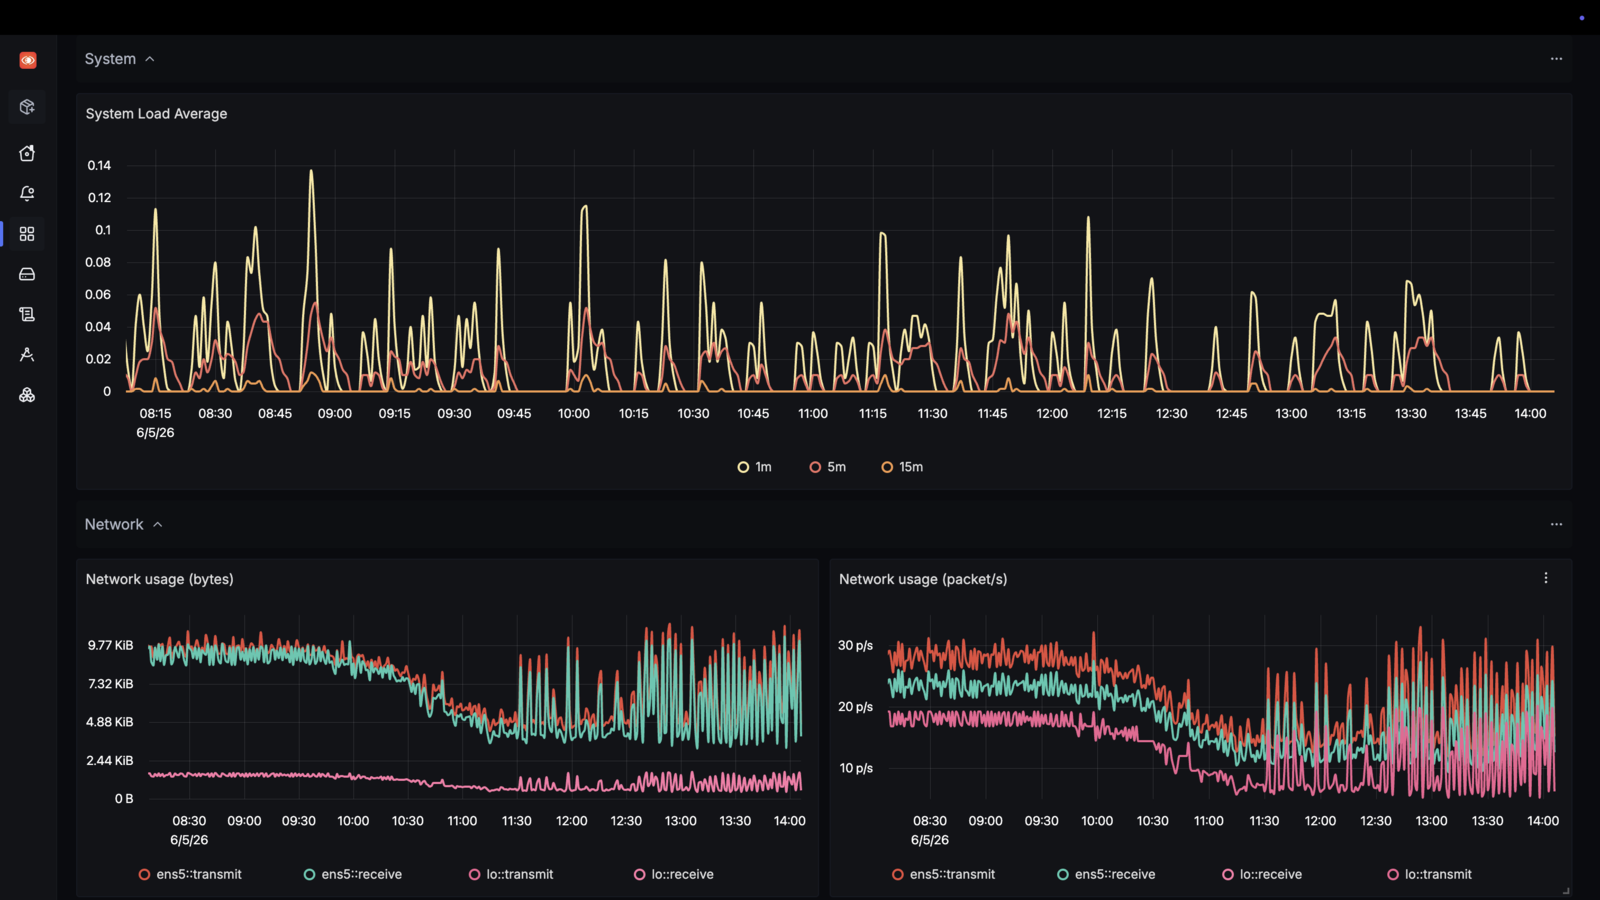
Monitor Kubernetes clusters, pods, nodes, workloads, and host-level CPU, memory, disk, network, logs, and traces.
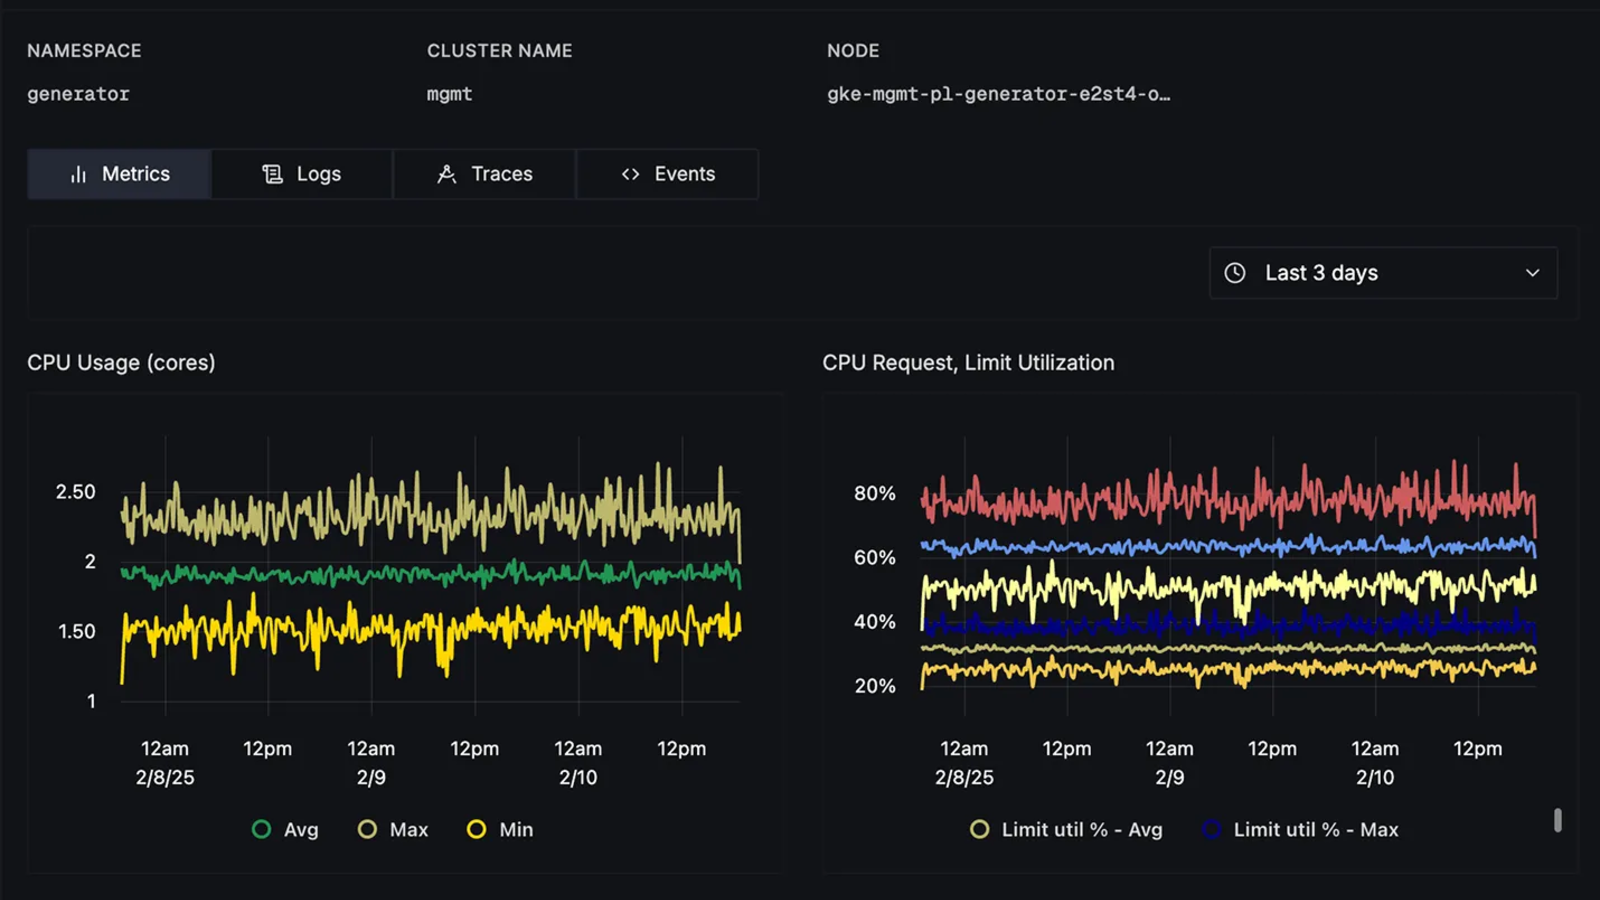
Learn more: Infrastructure monitoring documentation
Trace LLM apps, RAG pipelines, prompts, tool calls, tokens, latency, and costs alongside application and infrastructure telemetry.
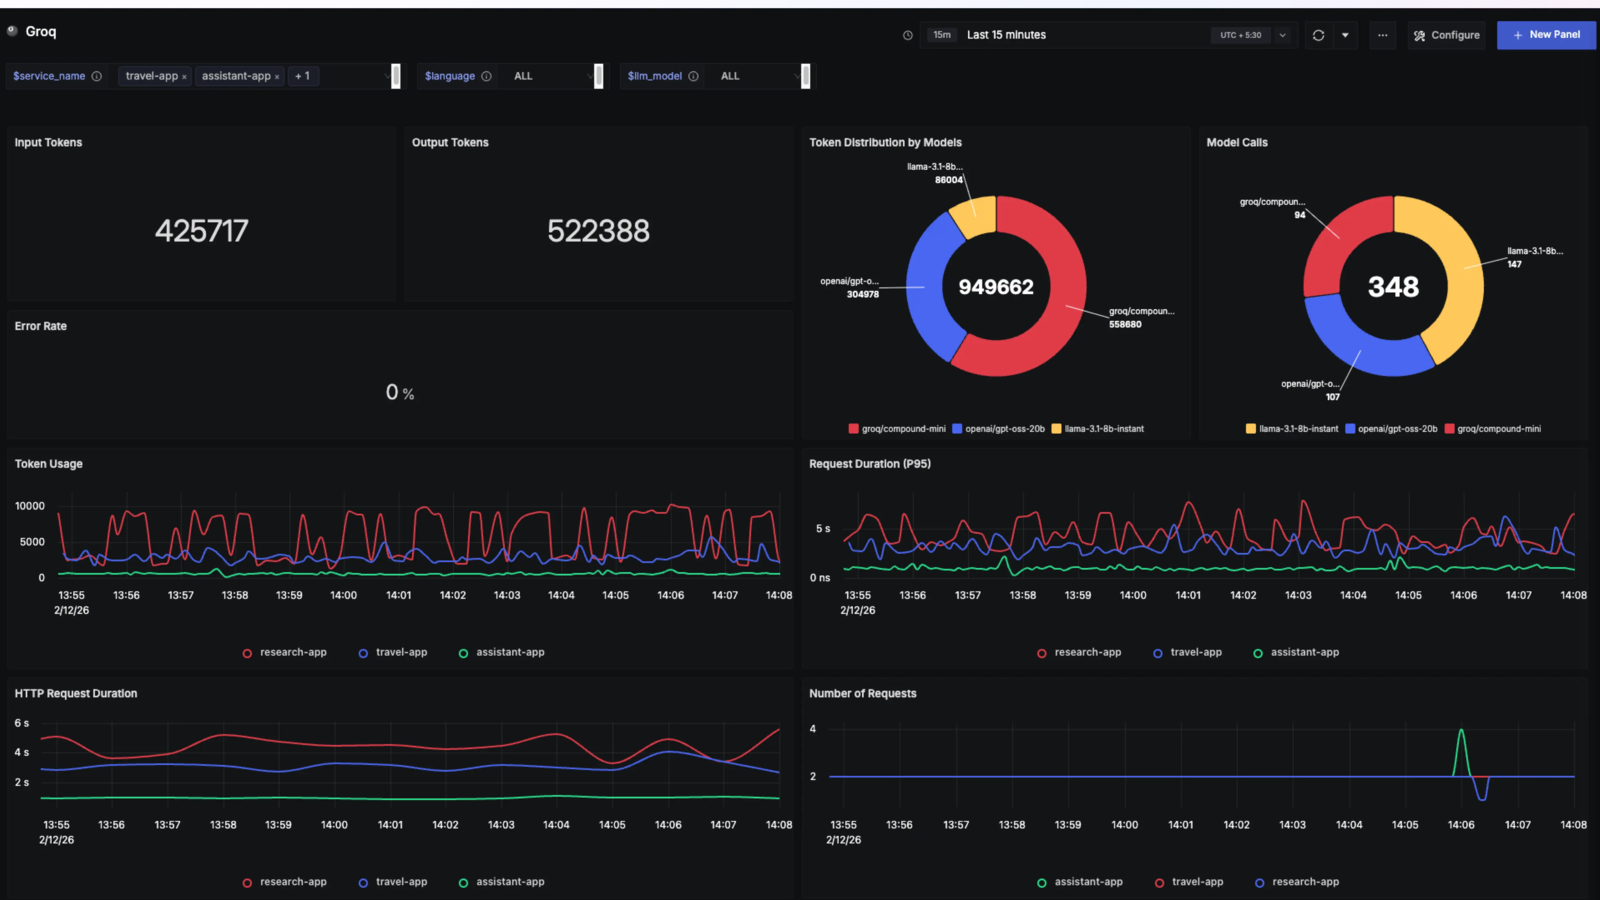
Learn more: LLM observability documentation
Use the SigNoz MCP server to bring telemetry into coding agents, or use Noz inside SigNoz to investigate incidents, tune alerts, and build dashboards with production context. Noz is available only on SigNoz Cloud.
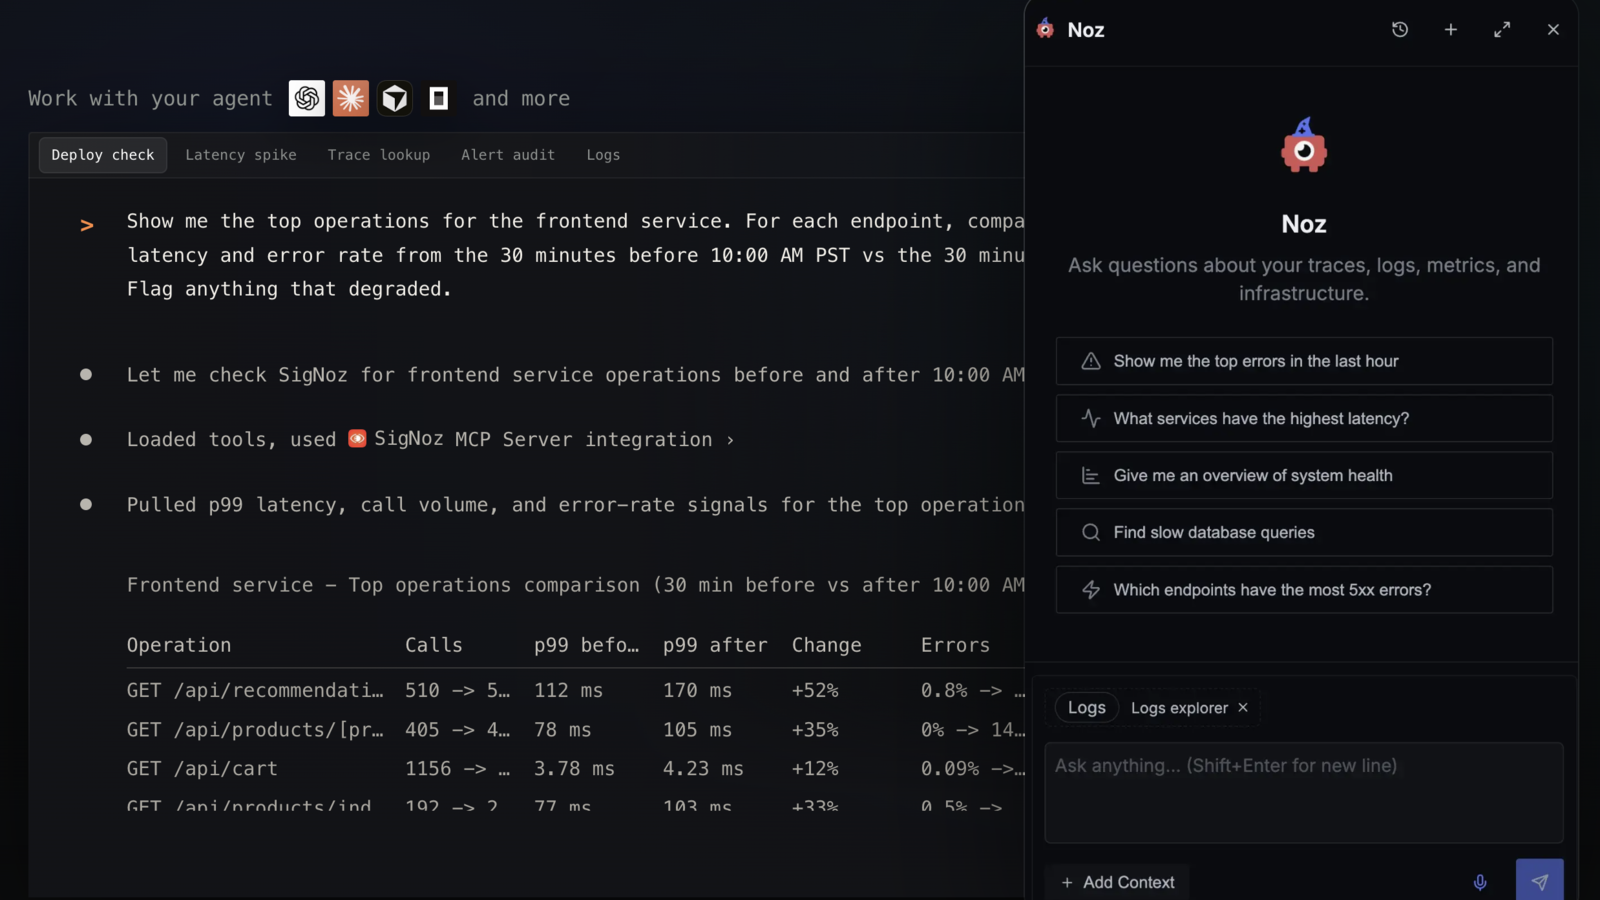
Learn more: SigNoz MCP server docs · Agent skills docs
Follow requests across services with flamegraphs, waterfalls, span events, filters, and trace analytics.
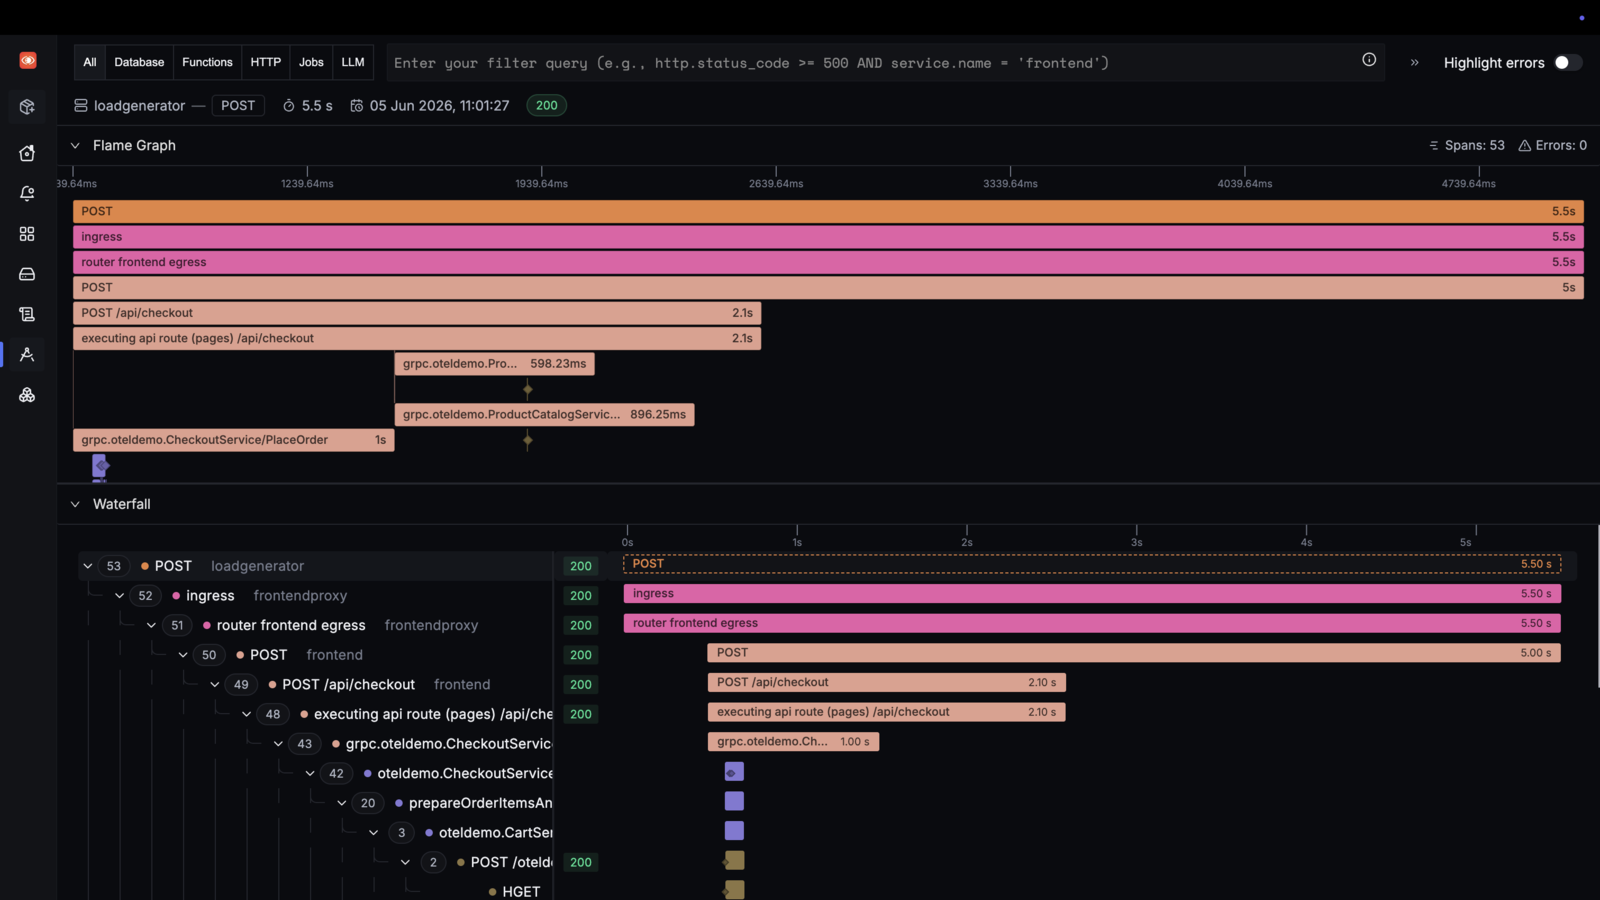
Learn more: Distributed tracing documentation
Create funnels from traces to understand request-flow drop-offs, failed transitions, and systemic workflow issues.
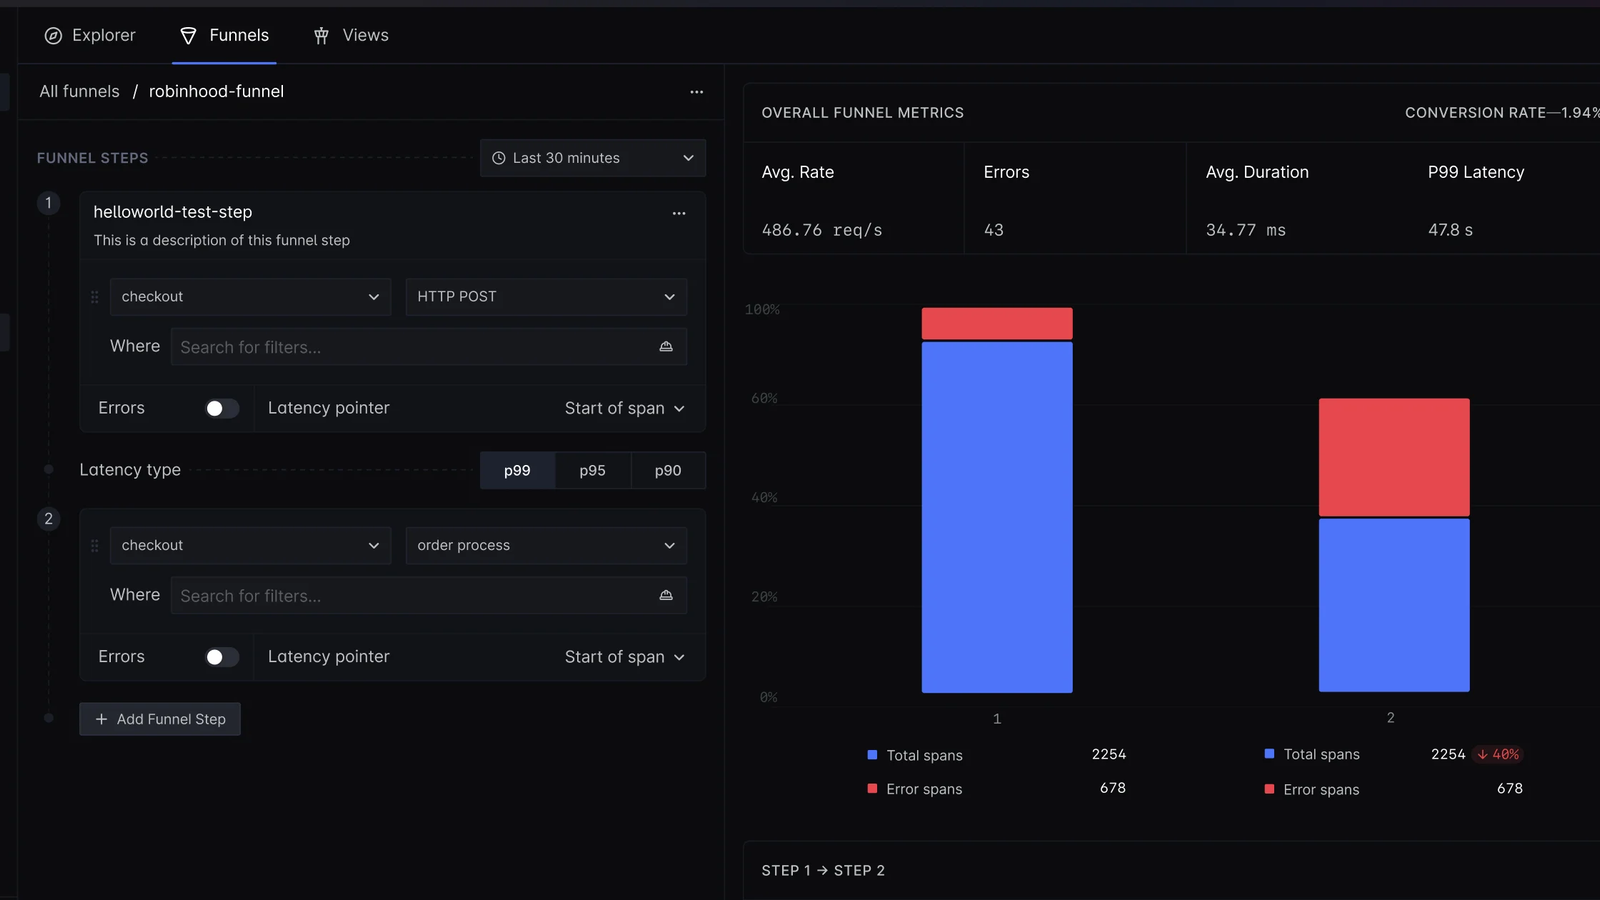
Learn more: Trace funnels documentation
Also monitor: exceptions, alerts, external APIs, and integrations for OpenTelemetry, Prometheus, Kubernetes, cloud providers, language SDKs, application frameworks, databases, and LLM tools.
- OpenTelemetry-native
Instrument once with open standards and keep ownership of your telemetry. - Correlated signals
Move from service charts to traces, logs, infra metrics, and exceptions without switching tools. - Single columnar database
Built for high-cardinality, high-volume observability workloads. - Predictable pricing
No per-host pricing, no user-seat pricing, and no special pricing for custom metrics. - Enterprise ready
SOC 2 Type II and HIPAA compliance, RBAC, ingestion controls, custom retention, support, BYOC, and self-hosting.
Create a managed SigNoz workspace and get your first dashboard without running observability infrastructure.
Run SigNoz in your own infrastructure with Foundry, Docker, Kubernetes, or Linux.
Foundry · Docker · Kubernetes · Linux
Instrument applications and infrastructure with OpenTelemetry, Prometheus, language SDKs, and integrations.
Instrumentation · Integrations
We ❤️ contributions big or small. Please read CONTRIBUTING.md to get started with making contributions to SigNoz.
Not sure how to get started? Just ping us on #contributing in our slack community.