Sending data to fitting automatically plots the data (#2299) #2315
Conversation
…utomatically-open-the-data-chart
 butlerpd
left a comment
butlerpd
left a comment
There was a problem hiding this comment.
I think this is going to require some discussion. However some first comments (ignoring the preferences issues since that really is another PR):
- The current implementation does not do what is really desired here. It basically implements a
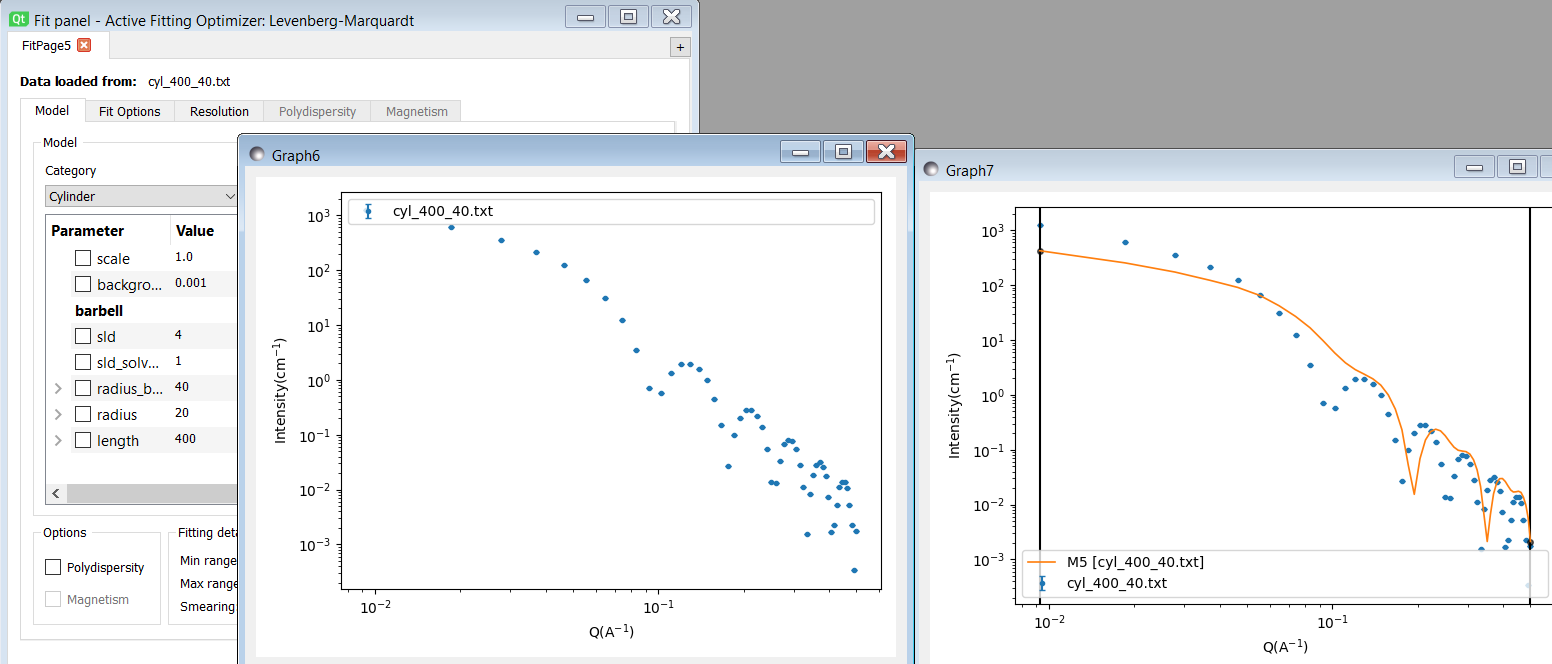
Create Newcall. Once I change a parameter and click compute a whole new set of 3 windows opens up. The point of the immediate plotting is for that first plot to be the one where the model fit also appears. In other words it should be the plot window tied to the fitpage. - This is attempting to implement the same for sending of multiple data and even for sending a batch fit. There is a ticket somewhere to allow multiple data sets to be sent to a single fitting plot with the data and their models all showing up together, but again this just does the same as
Create Newand creates a plot with all the data that is divorced from fitting. - Likewise the batch mode, which does not normally throw up plots (for obvious reasons I think), by default now gets a graph (not where fits go). This may in fact be a useful feature but not sure it should be tied to the same preference?
I would suggest that maybe one should try to limit to use case 1 for starters as perhaps the biggest bang for the buck? So just implement for a single file sent to fitting. @rozyczko seems to think isolating to only single file sends to fit should be trivial but the tying to the fit panel may be trickier?
|
and here is the issue I was thinking of ... interestingly it is a feature parity issue! #1685 |
…into-the-fitting-perspective' into 2299-sending-single-data-to-fitting-should-automatically-open-the-data-chart
 rozyczko
left a comment
rozyczko
left a comment
There was a problem hiding this comment.
Adding a new attribute is not necessary. We can already differentiate between data and model/data plots.
Data plots have their plot_role property set to 0, while model plots have 1.
It's probably enough to add a plot_role check.
| self._perspective().swapData(selected_items[0]) | ||
| if self._perspective().name == 'Fitting': | ||
| if config.FITTING_PLOT_ON_SEND_DATA: | ||
| self.newPlot() #todo sort out where the plot should go. |
There was a problem hiding this comment.
I guess this TODO explains why I get a separate data+model chart on Compute/plot.
Up to @butlerpd to decide if this is what we want the plots to behave.
| if self.chkSwap.isChecked(): | ||
| self._perspective().swapData(selected_items[0]) | ||
| if self._perspective().name == 'Fitting': | ||
| if config.FITTING_PLOT_ON_SEND_DATA: |
There was a problem hiding this comment.
Using and to concatenate the two conditionals looks slightly better as there is less levels of indentation.
Here and in the other cases
…into-the-fitting-perspective' into 2299-sending-single-data-to-fitting-should-automatically-open-the-data-chart
| #QtWidgets.QApplication.processEvents() | ||
| tab.showPlot() | ||
| #QtWidgets.QApplication.processEvents() | ||
| #time.sleep(2) |
There was a problem hiding this comment.
Playing with processEvents means there were issues with plot lifetimes? What did you observe?
| #time.sleep(2) | ||
| tab._model_model.clear() | ||
| tab.cmdPlot.setEnabled(False) | ||
| tab.SASModelToQModel('porod') |
There was a problem hiding this comment.
Why did you choose "porod" here, and not the currently active model?
| super(FittingPreferencesWidget, self).__init__("Fitting Settings") | ||
| self.addCheckBox(title="Auto-plot data when sent to fitting perspective", | ||
| callback=config_value_setter_generator('FITTING_PLOT_ON_SEND_DATA', dtype=bool), | ||
| checked=config.FITTING_PLOT_ON_SEND_DATA) No newline at end of file |
There was a problem hiding this comment.
this needs porting to the new way of describing preferences
Simple little implementation of #2299. Added a config option for users who might prefer the earlier behavior of pre-selecting a model.