


I turn ambiguous product questions into clean experiments, SQL pipelines, and decisions backed by data.
- Product experimentation — A/B test design, sample-size planning, guardrail metrics, reproducible reporting. CUPED, AA-tests, Bonferroni, Bayesian A/B.
- User lifecycle analytics — cohort retention, funnel analysis, RFM segmentation.
- End-to-end delivery — SQL → Python → dashboard → stakeholder narrative.
📦 Portfolio: 
🔗 Links: 
📄 CV: 
- 📚 Learning: Bayesian A/B testing, ClickHouse, dbt, Apache Airflow, Apache Superset
- 💼 Open to: BI / product / data analyst roles — actively interviewing
- 🤝 Collab: experimentation, user retention analytics
- 🚧 Building: interactive analyst portfolio — playable SVG games + self-hosted GitHub stats
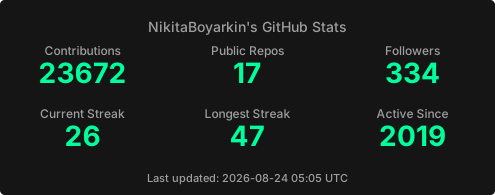
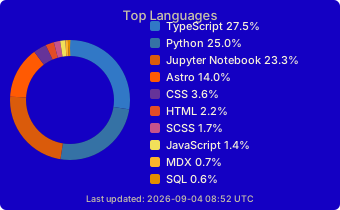
Last refreshed: 2026-09-04 08:52 UTC · 316 contributions in the last 7 days




End-to-end neobank analytics: funnel, A/B test, retention, segmentation. +6.24pp KYC conversion (Z=6.35, p<0.0001), €716K/yr — 48× ROI. CUPED + AA-test + Bonferroni.


Stack: Python · SciPy · Statsmodels · scikit-learn

Full-stack analytics platform: Streamlit + Supabase with RLS and an Edge Function. Significant A/B result (p=0.0034) on 8,000 seeded users, reproducible pipeline.

Stack: Python · Streamlit · Supabase · PostgreSQL

*Ten end-to-end SQL cases on DuckDB — funnel, N-day retention, DAU/MAU stickiness, LTV, streaks, A/B conversion, attribution. One command, no server, pytest-verified.*

Stack: SQL · DuckDB · pytest

🐍 Snake classic · arrows / WASD
|

🧪 A/B Test click until p < 0.05
|

🏓 Pong beat the CPU · first to 11
|

🔢 2048 merge tiles to 2048
|

🔻 Funnel Drop catch users through the funnel
|

📊 Cohort Catch catch returning users
|
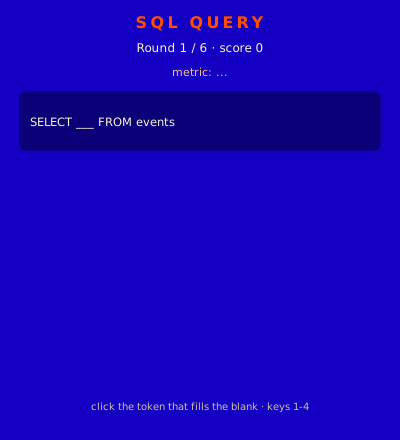
🧩 SQL Query fill the blank
|

🃏 Metric Match match metric to formula
|
Click a card to play the game full screen — opens in a new tab.
| Game | Controls | Goal |
|---|---|---|
| 🐍 Snake | Arrows / WASD · R to restart | Eat food, grow longer, don't hit walls or yourself |
| 🧪 A/B Test | Click anywhere (or Space / Enter) | Collect data until the p-value drops below 0.05 |
| 🏓 Pong | W/S or ↑/↓ — or move the mouse · R to restart | Beat the CPU — first to 11 |
| 🔢 2048 | Arrows / WASD · R to restart | Slide and merge tiles to reach 2048 |
| 🔻 Funnel Drop | ←/→ or move the mouse | Catch falling users to convert them |
| 📊 Cohort Catch | ←/→ or move the mouse | Catch Returning users (green), avoid Churned (grey) |
| 🧩 SQL Query | Click an option (or keys 1-4) | Pick the token that fills the SQL blank |
| 🃏 Metric Match | Click two cards | Match each metric to its formula |
- Кейсы с собеседований: как диагностировать просадку метрики
- Проактивность аналитика за рамками роли
- Churn + uplift: кому дать скидку (причинный таргетинг)
- EDA-шаблон с кодом: разведочный анализ по-продуктовому
- Feature Impact: как измерить влияние фичи, когда A/B невозможен
Auto-updated daily from the site RSS via GitHub Actions.
Languages & Libraries


Databases & Warehouses


Visualization & BI


Orchestration & Dev Tools








Dynamic cards powered by github-readme-stats, lowlighter/metrics, streak-stats, activity-graph, snk, blog-post-workflow, skill-icons.