A Grammar of Graphics for Kotlin.


Lets-Plot Kotlin API is a Kotlin API for Lets-Plot Multiplatform
plotting library,
which is built on the principles of layered graphics first described in the
Leland Wilkinson work The Grammar of Graphics.
|
Lets-Plot Kotlin API is largely based on the API To learn more about the Grammar of Graphics, This will be a good prerequisite for further exploration of the Lets-Plot library. |
Inside Kotlin Notebook, Datalore or Jupyter with Kotlin Kernel:
%use lets-plot
val rand = java.util.Random()
val data = mapOf(
    "rating" to List(200) { rand.nextGaussian() } + List(200) { rand.nextGaussian() * 1.5 + 1.5 },
    "cond" to List(200) { "A" } + List(200) { "B" }
)

var p = letsPlot(data)
p += geomDensity(color = "dark_green", alpha = .3) { x = "rating"; fill = "cond" }
p + ggsize(700, 350)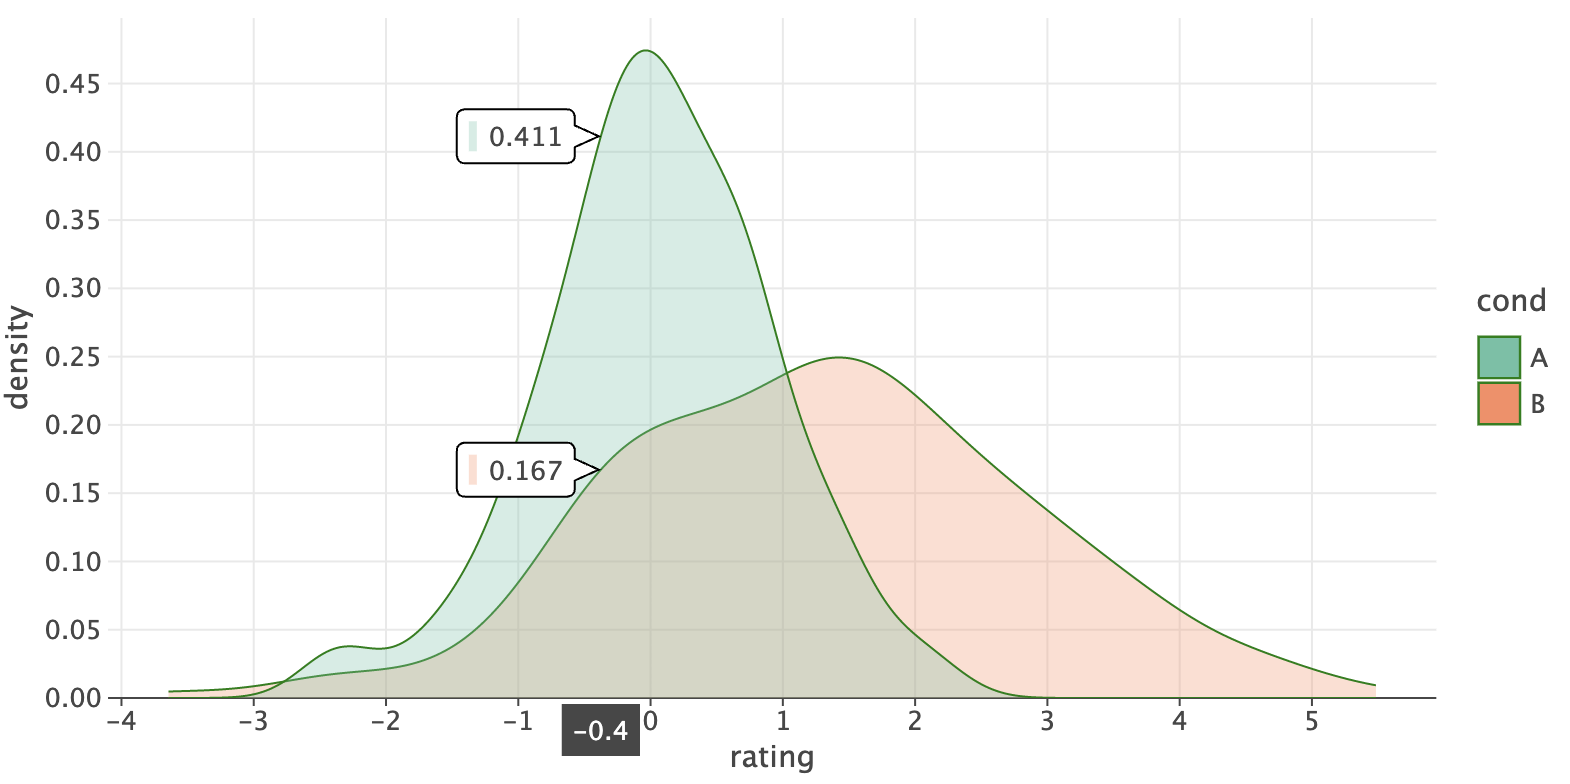
See the "Quickstart" notebook in Datalore or Jupyter nbviewer.
- Usage
- Documentation
- What is new in 4.12.0
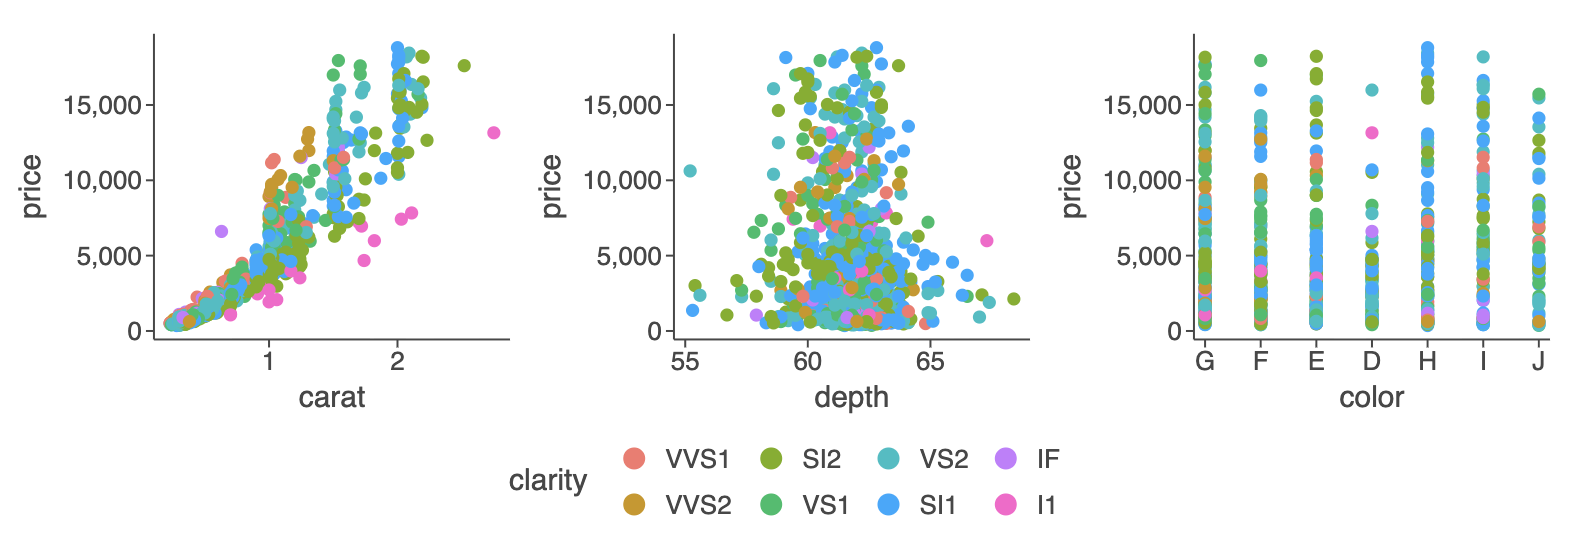
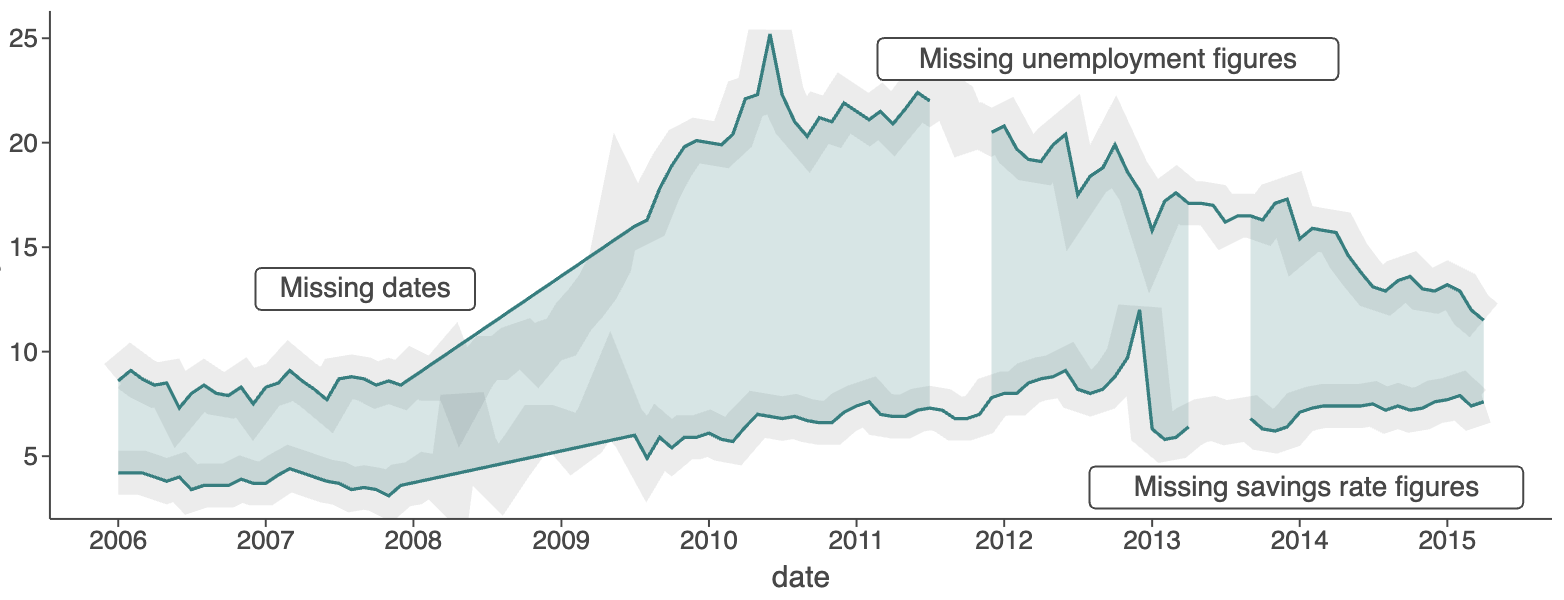
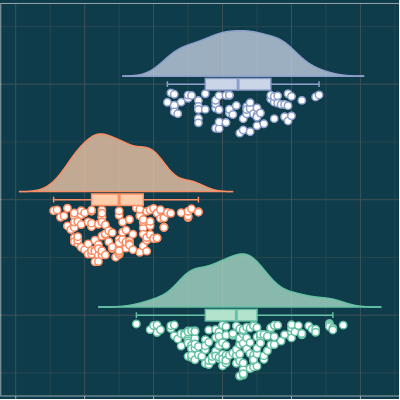
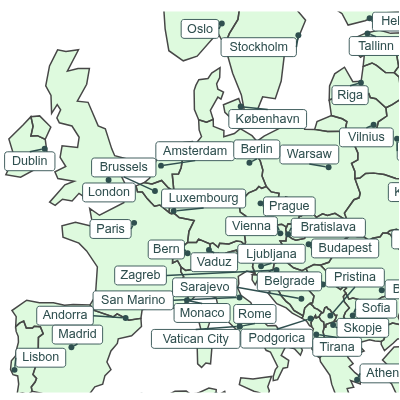
- Recent Updates in the Gallery
- Change Log
- Code of Conduct
- License
With the help of Lets-Plot Kotlin API you can easily create plots in Kotlin Notebook,
Datalore, Jupyter with Kotlin Kernel
or any other notebook that supports Kotlin Kernel.
%use lets-plot
This "line magic" will apply Lets-Plot library descriptor which adds to your notebook all the boilerplate code necessary to create plots.
By default, library descriptor is bundled with the Kotlin Jupyter Kernel installed in your environment.
However, you can override the default settings using:
%useLatestDescriptors
In this case the latest library descriptor will be pulled from the Kotlin Jupyter Libraries repository.
%use lets-plot(v=4.12.0, isolatedFrame=false, output="js, ktnb, svg")
-
v- version of the Lets-Plot Kotlin API. -
isolatedFrame- Iffalse: load JS just once per notebook (default in Jupyter).
Iftrue: include Lets-Plot JS in each output (default in Datalore notebooks). -
output- comma-separated list of output types to store in notebook cells (default:"js, ktnb, svg"). \
Available types:js- Classic Web output: HTML+JSktnb- Kotlin Notebook Swing-based renderingsvg- Static SVG outputpng- Static PNG output
Note: Static images (SVG/PNG) are hidden when
jsorktnboutputs are present, and only displayed in environments where JavaScript is not executed (e.g., GitHub).This option can be helpful when file size becomes a problem. For example, storing only static output (SVG or PNG) can significantly reduce file size when working with large datasets where plot interactivity is not a priority.
To learn how to embed Lets-Plot charts in Compose Multiplatform applications, please check out the Lets-Plot Compose Frontend project at GitHub.
To learn more about creating plots in JVM or Kotlin/JS environment, please read USAGE_SWING_JFX_JS.md.
Examples of using the Lets-Plot Kotlin API in JVM and Kotlin/JS applications are available in the Lets-Plot Kotlin Mini Apps (Demos) GitHub repository.
-
Lets-Plot Kotlin API documentation and API reference: Lets-Plot for Kotlin
-
A quick introduction to the Grammar of Graphics and Lets-Plot Kotlin API: Lets-Plot Usage Guide
-
See: example notebook.
Important
BREAKING CHANGE:
Previously, setting group='variable' would group by both the explicit variable AND any discrete
aesthetics (color, shape, etc.).
Now it groups ONLY by the explicit variable, matching ggplot2 behavior.
Use group=[var1, var2, ...] to group by multiple variables explicitly,
and group=[] to disable any grouping.
See: example notebook.
-
See: example notebook.
-
See: example notebook.
-
See: example notebook.
-
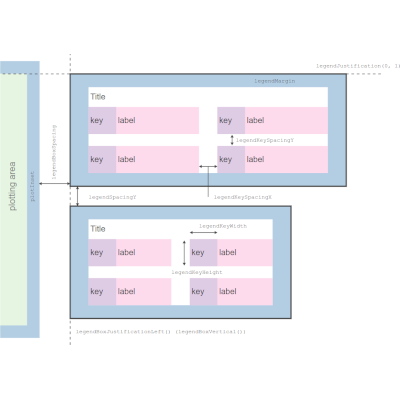
Legend automatically wraps to prevent overlap — up to 15 rows for vertical legends and 5 columns for horizontal ones
See: example notebook.
-
Use to override other flavors or make defaults explicit.
See: example notebook.
-
thememethods controlling legend justification:legendJustificationTop(),legendJustificationRight(),legendJustificationBottom(), andlegendJustificationLeft()See: example notebook.
-
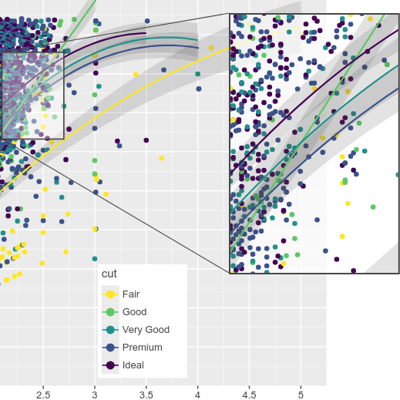
ggtb(): AddedsizeZoominandsizeBasisparameters to control point size scaling behavior when zooming (works withgeomPointand related layers).See: example notebook.
-
See CHANGELOG.md for a full list of changes.
Recent Updates in the Gallery
See CHANGELOG.md.
This project and the corresponding community are governed by the JetBrains Open Source and Community Code of Conduct. Please make sure you read it.
Code and documentation released under the MIT license. Copyright © 2019-2025, JetBrains s.r.o.