
The World's Fastest .NET WPF, WinForms, and MFC C++ Charting Components. GPU compute shader accelerated. AI-assisted development. Intelligent rendering. Mission-critical quality since 1993.
Founded in 1993, Gigasoft has concentrated exclusively on charting for over 30 years — scientific, engineering, and financial data visualization at a mission-critical level. Prioritizing stability, speed, and rendering intelligence. Fast expert support. No hassle evaluation download.
ProEssentials is architecturally different from every competitor — a native Win32 DLL charting engine with two complete API layers: a hierarchical .NET property interface for WPF and WinForms, and a standard C/C++ DLL API for MFC, Delphi, ActiveX, and any language with DLL FFI capability. Both APIs access the same rendering engine, the same GPU compute shaders, and the same 1,200+ chart properties.
ProEssentials v10 includes a purpose-built AI Code Assistant that transforms how you implement charts. The pe_query.py tool gives AI assistants on-demand access to the complete ProEssentials API — 1,200+ properties, 167 enumerations, and 116 working code examples — with a built-in validation layer that cross-checks every property path against DLL ground truth, eliminating the hallucinated code that plagues generic AI coding.
Works with Claude, ChatGPT, Gemini, GitHub Copilot, and Cursor. Included free with every ProEssentials v10 license.
➡️ Explore the AI Code Assistant
| Object | Best For |
|---|---|
| Pego | Bar, line, area, OHLC — dashboards, financial charts |
| Pesgo | Scientific XY scatter, real-time streaming, irregular time-series |
| Pe3do | 3D surface, wireframe, contour |
| Pepso | Polar, Smith chart, radar/spider |
| Pepco | Pie charts |
| Platform | Supported |
|---|---|
| WPF (.NET 8 / .NET 6 / .NET 4.8) | ✅ Native WPF controls |
| WinForms (.NET 8 / .NET 6 / .NET 4.8) | ✅ Native WinForms controls |
| C++ MFC / Win32 | ✅ Native DLL API |
| Delphi VCL | ✅ Native DLL API |
| ActiveX / COM / Access / Excel | ✅ OCX controls |
| ASP.NET Web Forms | ✅ |
| LabVIEW | ✅ via ActiveX |
| Any language with DLL FFI | ✅ Standard Win32 DLL |
➡️ Full Platform Coverage Comparison
ProEssentials is the only WPF charting library with a true perpetual license. Pay once. Use forever. Free unlimited support for life. Royalty-free deployment to unlimited end-user machines. No annual renewal. No subscription expiry traps. No reactivation fees.
➡️ Pricing & Support Comparison vs SciChart, LightningChart, Syncfusion, DevExpress
| Resource | Link |
|---|---|
| ⬇️ No-hassle evaluation download | Download |
| 📖 Developer Guide | gigasoft.com/developer-guide |
| 🚀 WPF .NET 8 Walk-Through | gigasoft.com/wpf-chart-nuget |
| 🚀 WinForms .NET 8 Walk-Through | gigasoft.com/net-chart-nuget |
| 🔍 API Explorer | gigasoft.com/documentation |
| 💬 Contact & Support | gigasoft.com/contact |
Every demo is a GPU-accelerated ProEssentials v10 chart sample for C# on .NET 8. Most ship for both WPF and WinForms — pick your platform from the links beside each preview.
GPU compute shader rendering of millions to hundreds of millions of points per update — real-time streaming, oscilloscope, and live data charts for C# .NET applications.
| Preview | Demo |
|---|---|
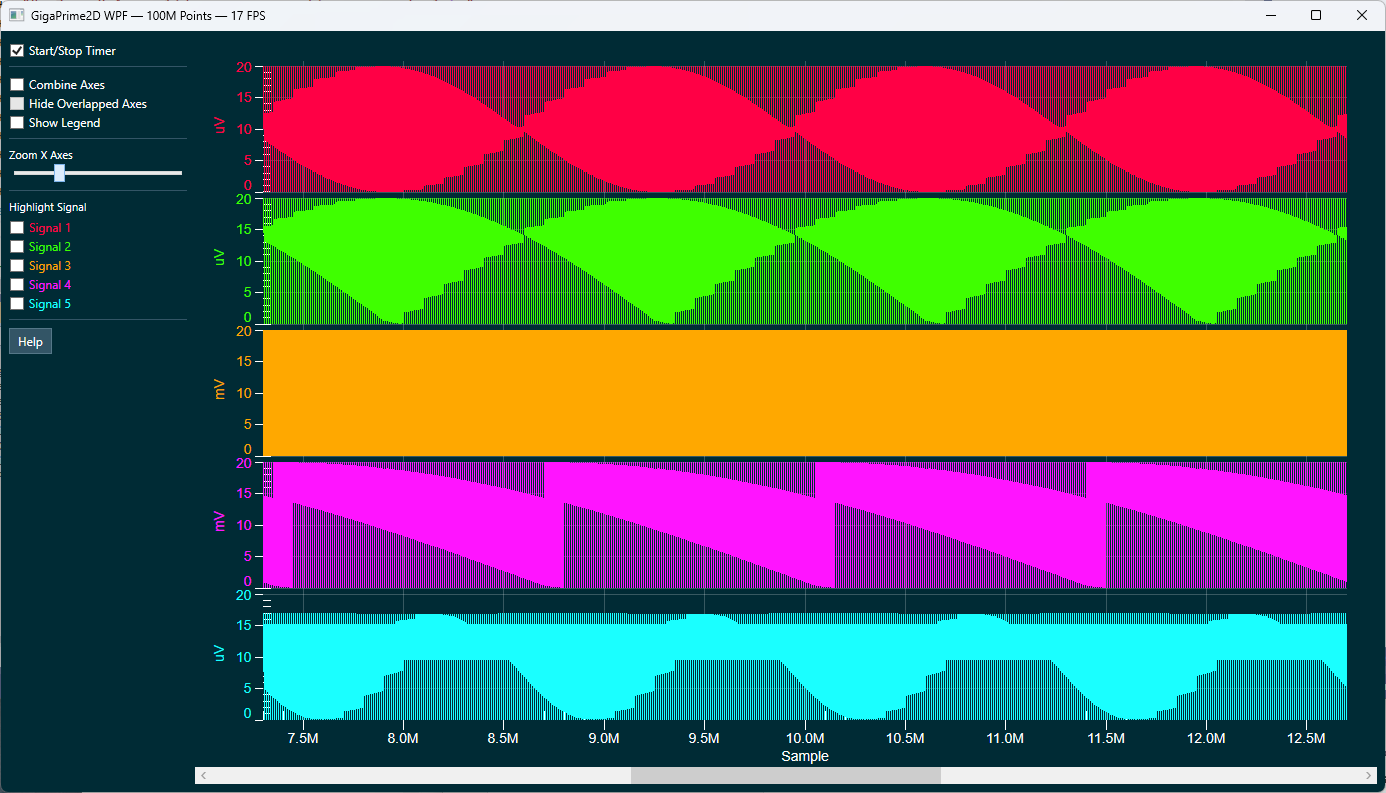 |
100 Million Points — Fastest Demo WPF · WinForms .NET 8 — a demonstration of GPU compute shader rendering: 100 million data points completely re-passed and re-rendered per timer tick. Live FPS displayed in the title bar. |
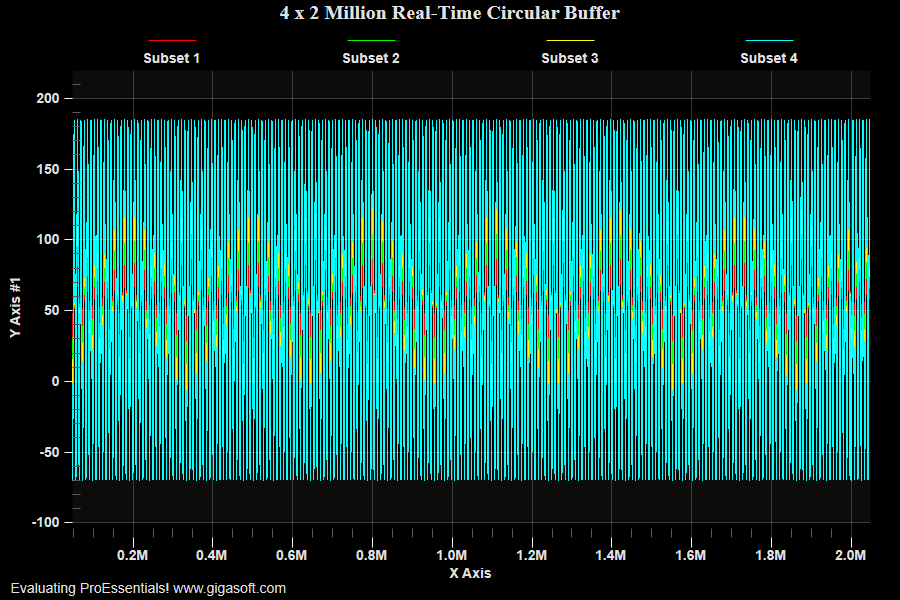 |
Real-Time Circular Buffer — 8M Points, Zero-Copy WPF · WinForms .NET 8 — 4 subsets × 2,000,000 points streamed in real time via zero-copy UseDataAtLocation + CircularBuffers + Direct3D ComputeShader. A timer appends 150 samples/subset every 15ms; a right-click submenu toggles Stationary vs Scrolling zoom. |
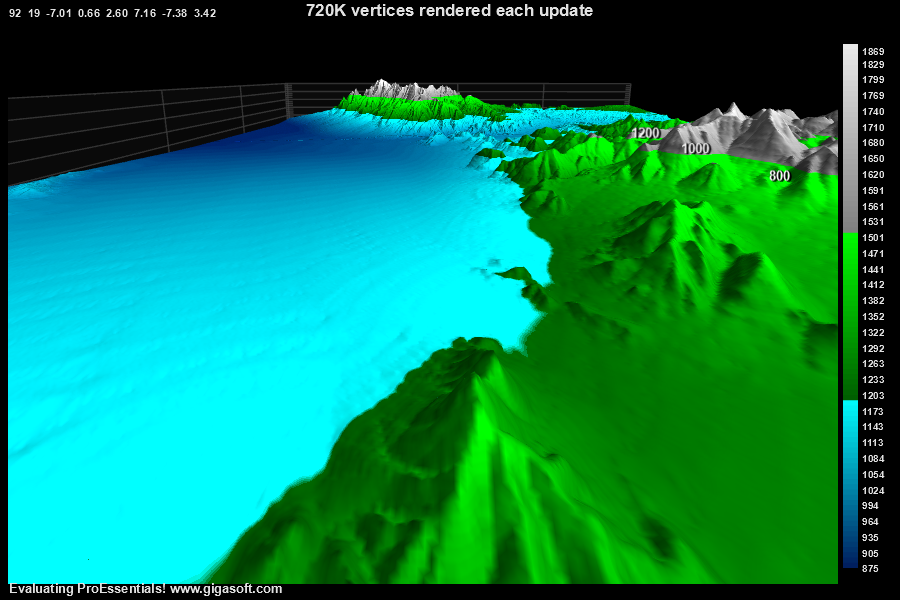 |
Real-Time 3D Surface — Compute Shader WPF · WinForms .NET 8 — the fastest possible realtime 3D surface update: 720,000 vertices rebuilt every 15 ms using GPU compute shaders and a zero-copy circular-buffer append strategy. A single Pe3do 3D chart, Direct2D. |
 |
Real-Time Spectrogram Heatmap WPF · WinForms .NET 8 — a realtime heatmap/spectrogram that replaces the entire 93,696-value surface every 25ms using a tiled data pool + Array.Copy + zero-copy UseDataAtLocation, GPU ComputeShader. Direct3D. |
GPU-accelerated 3D surface, height-map, point cloud, and Delaunay triangulation charts for scientific, engineering, and terrain visualization in WPF and WinForms.
| Preview | Demo |
|---|---|
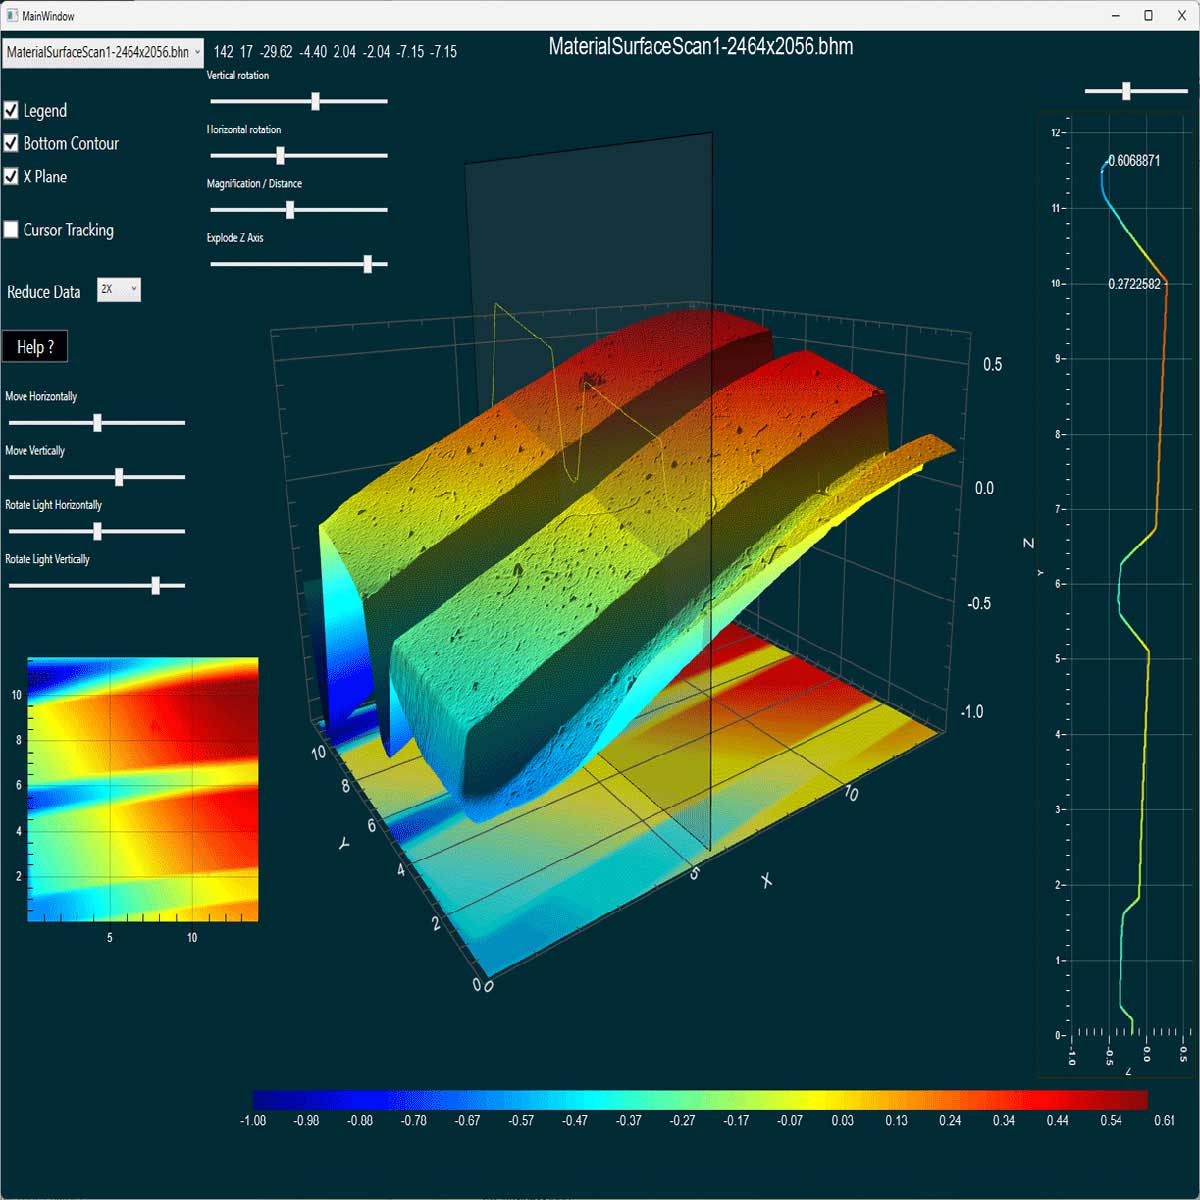 |
3D Surface Height Map (flagship 3D/2D demo) WPF Likely the most impressive functioning, performing, efficient 3D/2D combo example you will find on GitHub. A .NET 8 demonstration of GPU compute shader 3D surface rendering — real material surface and terrain height-map data visualized across three synchronized charts. |
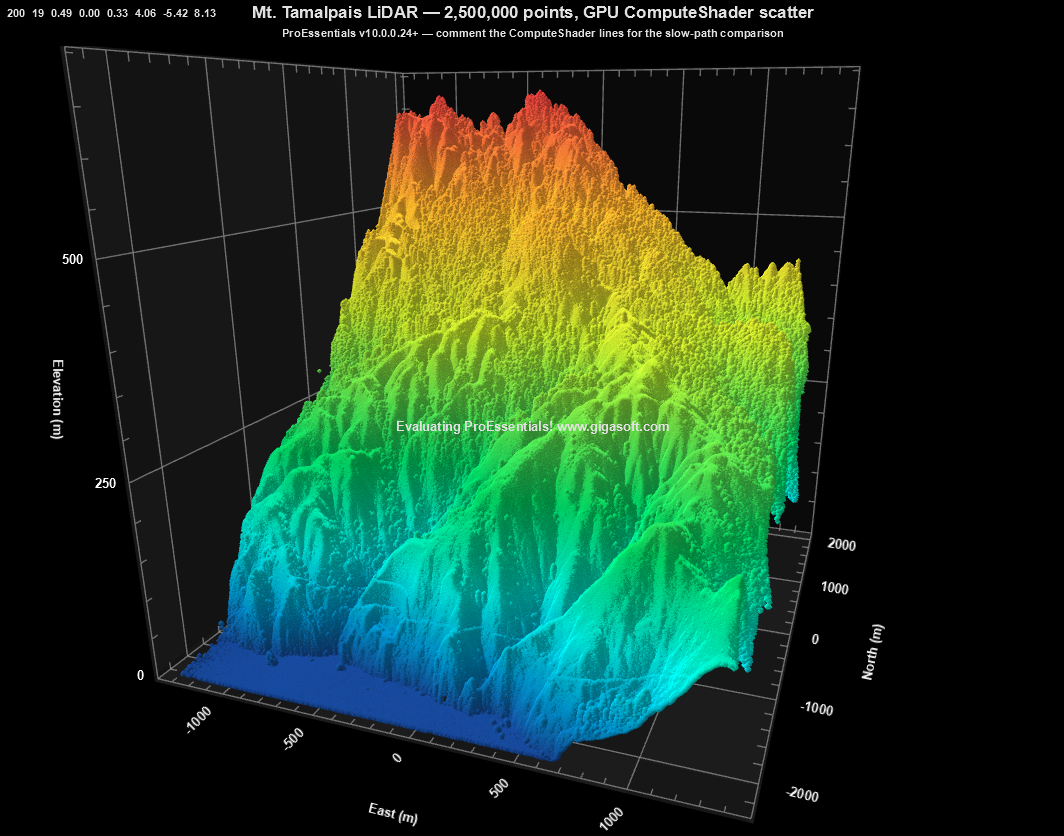 |
3D LiDAR Point Cloud — 2.5M Returns WPF · WinForms .NET 8 demonstration of the v10.0.0.24 ComputeShader path for PolyMode = Scatter — rendering 2.5M Mt. Tamalpais LiDAR returns as a 3D scatter cloud with every point individually colored by elevation. |
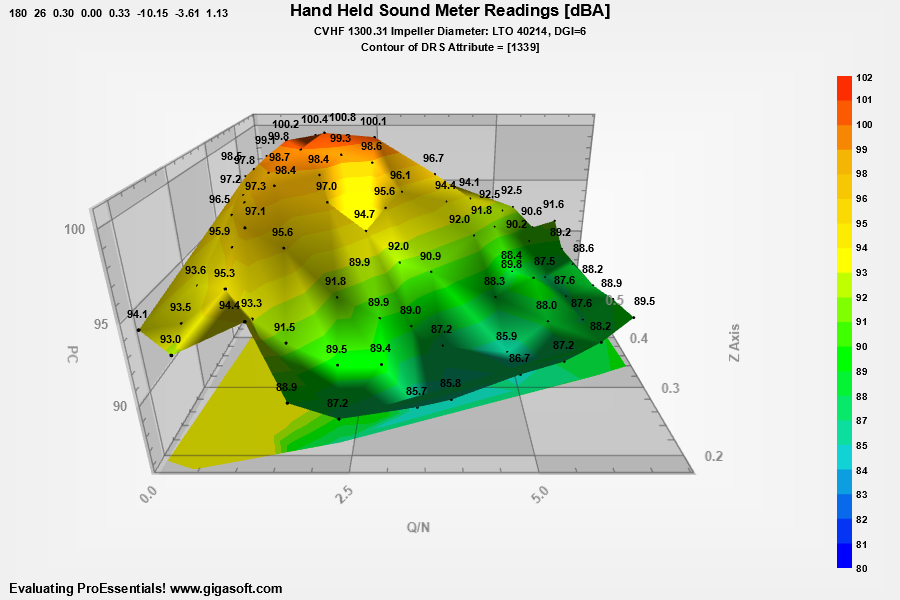 |
3D Delaunay Triangulation Surface WPF · WinForms .NET 8 — a Pe3do Delaunay-triangulated 3D surface with contour coloring, built from 70 scattered XYZ sound-meter readings. Direct3D. |
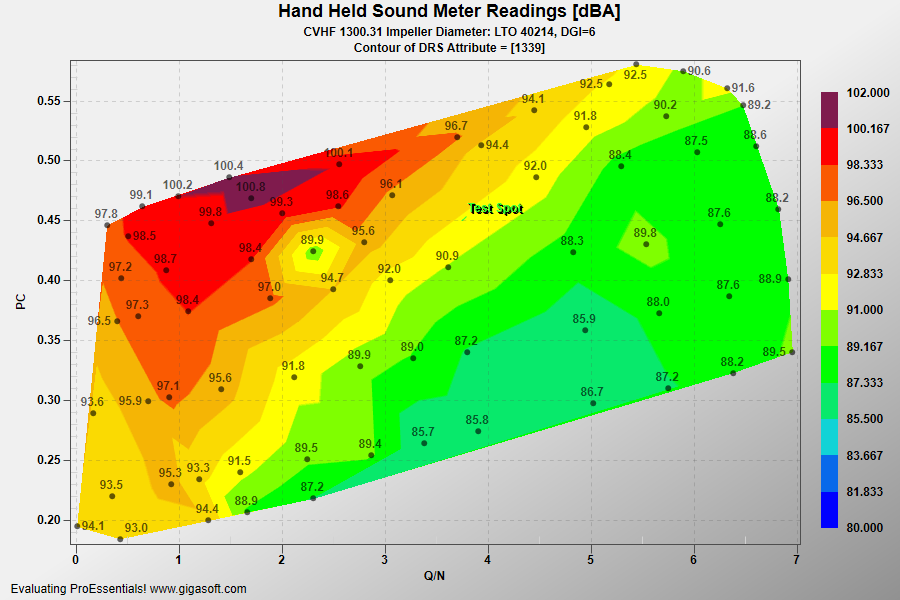 |
Delaunay Triangulation 2D Contour WPF · WinForms .NET 8 — a Pesgo continuous Delaunay contour fill (SGraphPlottingMethod.ContourDelaunay) from 70 scattered XYZ sound-meter readings, with a custom tooltip and a title-bar interpolated-Z readout. Direct3D composite. |
Well log, cement bond log (VDL), ultrasonic borehole imaging, wellbore trajectory, and NEXRAD radar charts for oil & gas, geophysical, and GIS software.
| Preview | Demo |
|---|---|
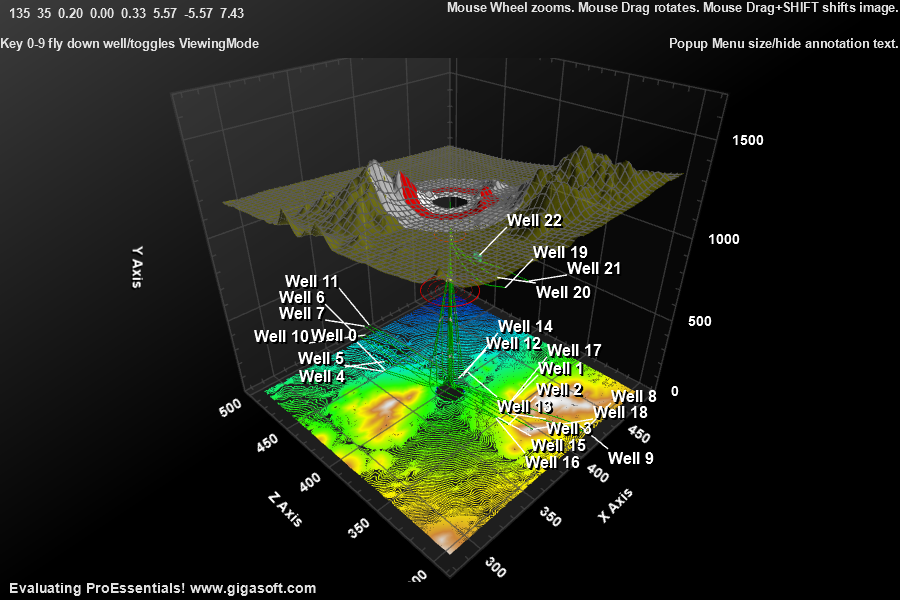 |
3D Wellbore Flythrough (Oil & Gas GIS) WPF · WinForms .NET 8 — a complete 3D subsurface visualization with an animated roller-coaster style camera flythrough down multiple wellbore trajectories, using a single Pe3do Direct3D chart object. |
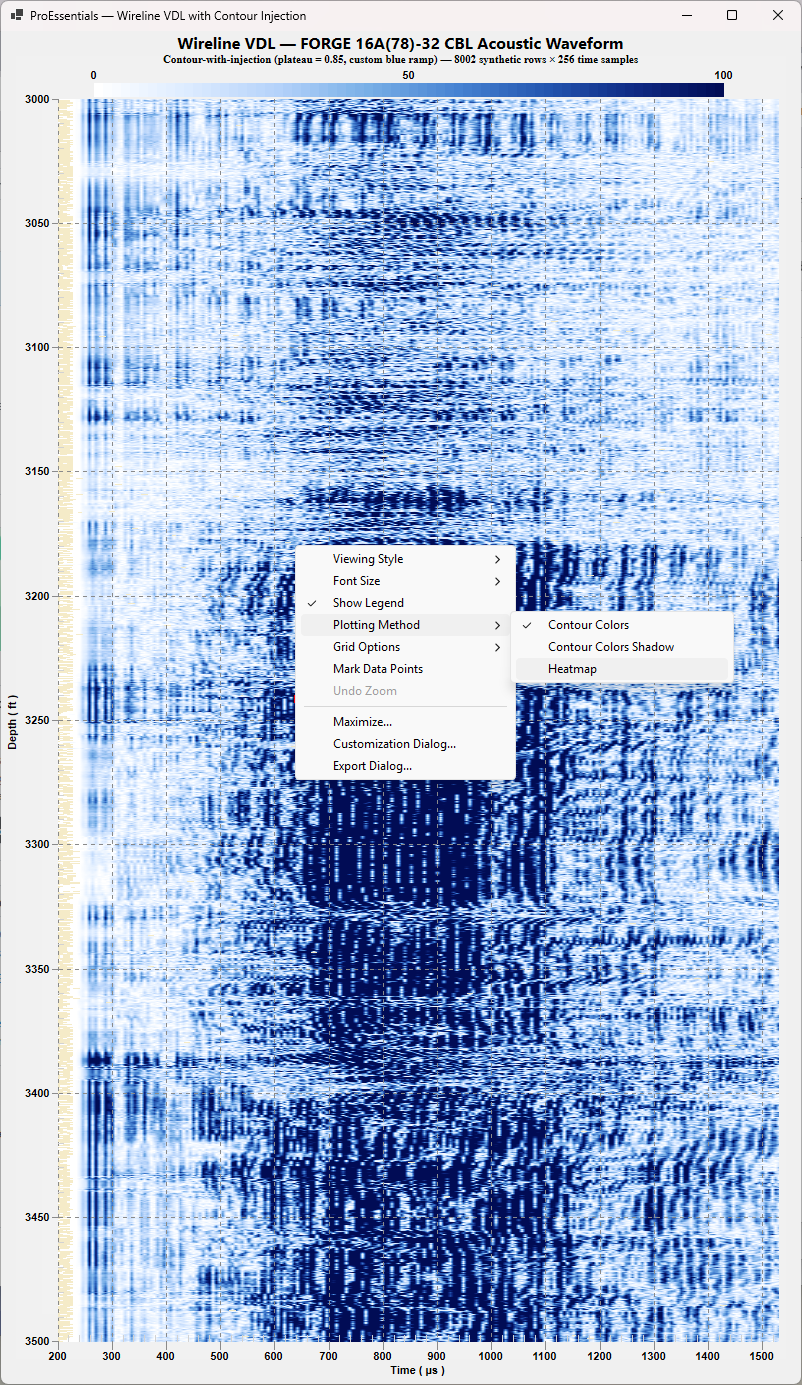 |
VDL Wireline Acoustic — Cement Bond Log WPF · WinForms .NET 8 — a wireline Variable Density Log (VDL) acoustic visualization for cement bond evaluation. Time on X (~200–1200 µs), depth on Y (feet), color = waveform amplitude, rendered with a contour-with-injection technique that keeps cells crisp at scale. Direct3D + GPU compute shader, custom 8-stop blue ramp. |
 |
Ultrasonic Borehole Image — Dual Contour WPF · WinForms .NET 8 — dual-channel ultrasonic borehole image (AWCN amplitude + TTCN transit time) rendered as a single concatenated contour chart sharing one colormap, one zoom, one rendering pass. A top-right overlay button toggles null rendering (Black / Gaps). Direct3D + GPU compute shader. |
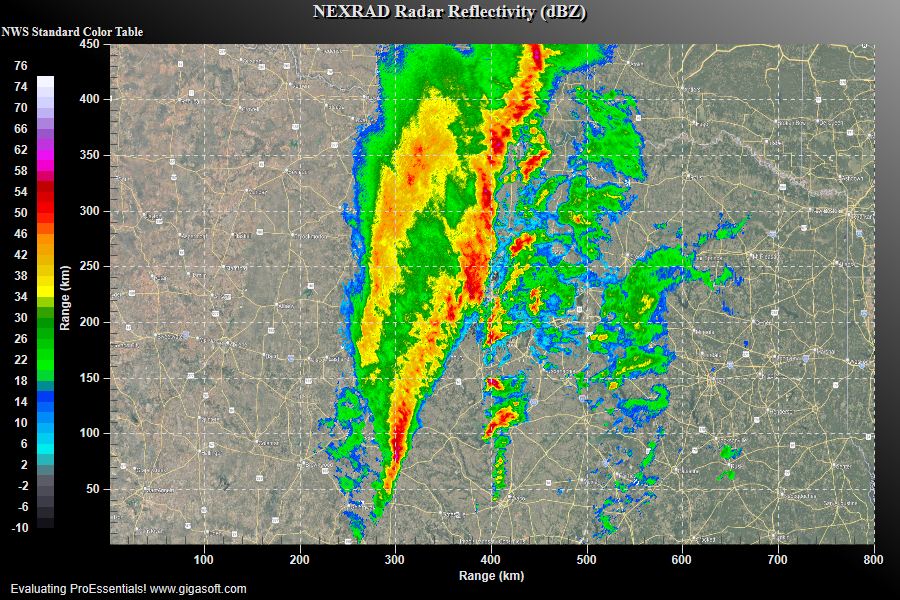 |
NEXRAD Doppler Radar Reflectivity WPF · WinForms .NET 8 — real NEXRAD Level II radar data from KFWS (Dallas/Fort Worth) rendered as an 800×450 2D contour chart with the official NWS standard reflectivity color table, a geographic map background, and a custom XYZ tooltip. Direct3D + ComputeShader. |
GPU-rendered 2D contour and heatmap charts with color-mapped surfaces — spectrograms, frequency analysis, and intensity maps for scientific data.
| Preview | Demo |
|---|---|
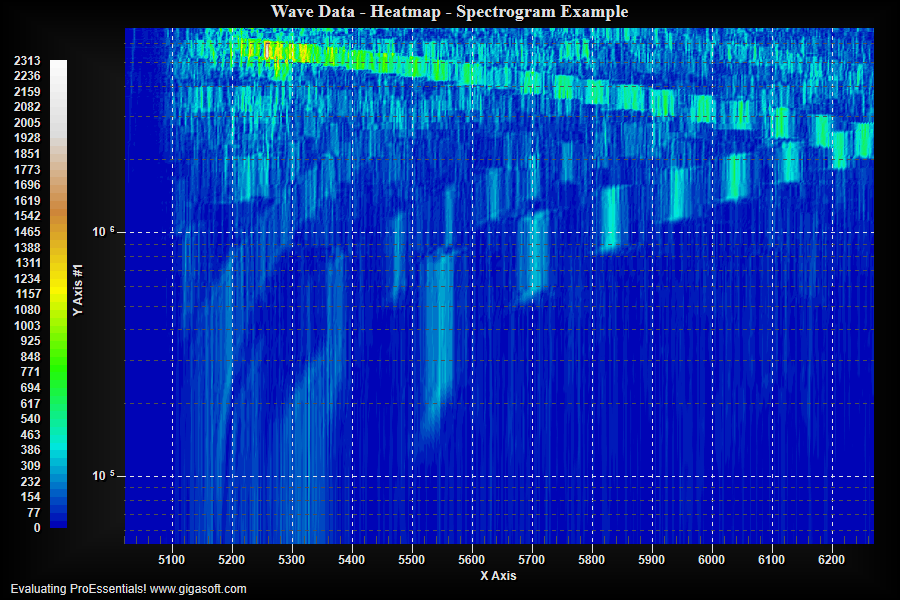 |
2D Spectrogram Heatmap (frequency) WPF · WinForms .NET 8 — a full-featured heatmap / spectrogram / 2D contour visualization (frequency vs time vs amplitude) using Pesgo with ContourColors, log Y axis, and GPU ComputeShader. Direct3D. |
OHLC candlestick, technical indicator, trading signal, and audio waveform oscilloscope charts for financial and signal-processing applications.
| Preview | Demo |
|---|---|
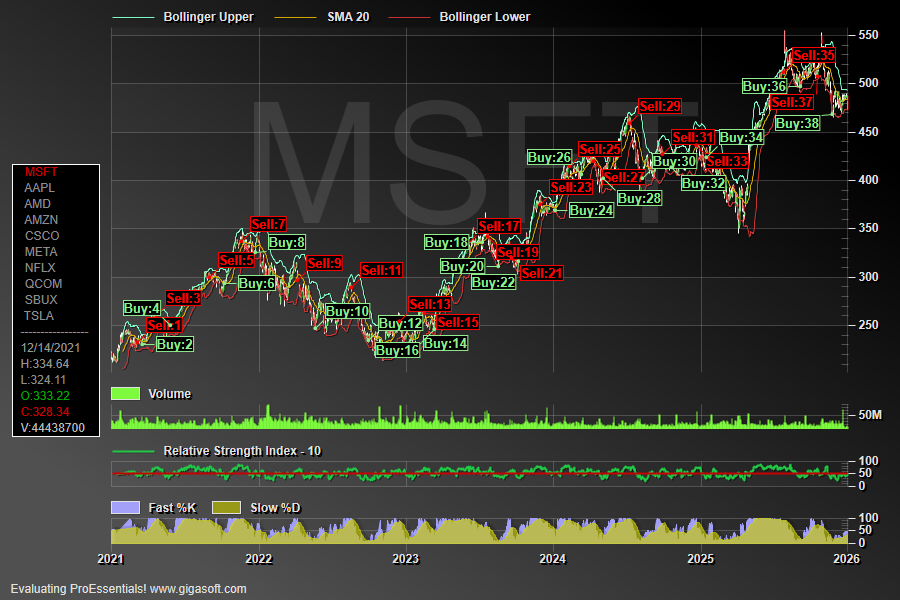 |
Financial OHLC + Trading Signals WPF · WinForms .NET 8 — a complete financial charting app built on Pego (the categorical / date-axis graph object): OHLC candlesticks for ten real stock symbols with Bollinger Bands, RSI, a custom stochastic oscillator, and Buy/Sell signal annotations generated from stochastic turning points. Direct2D, four synchronized multi-axes. |
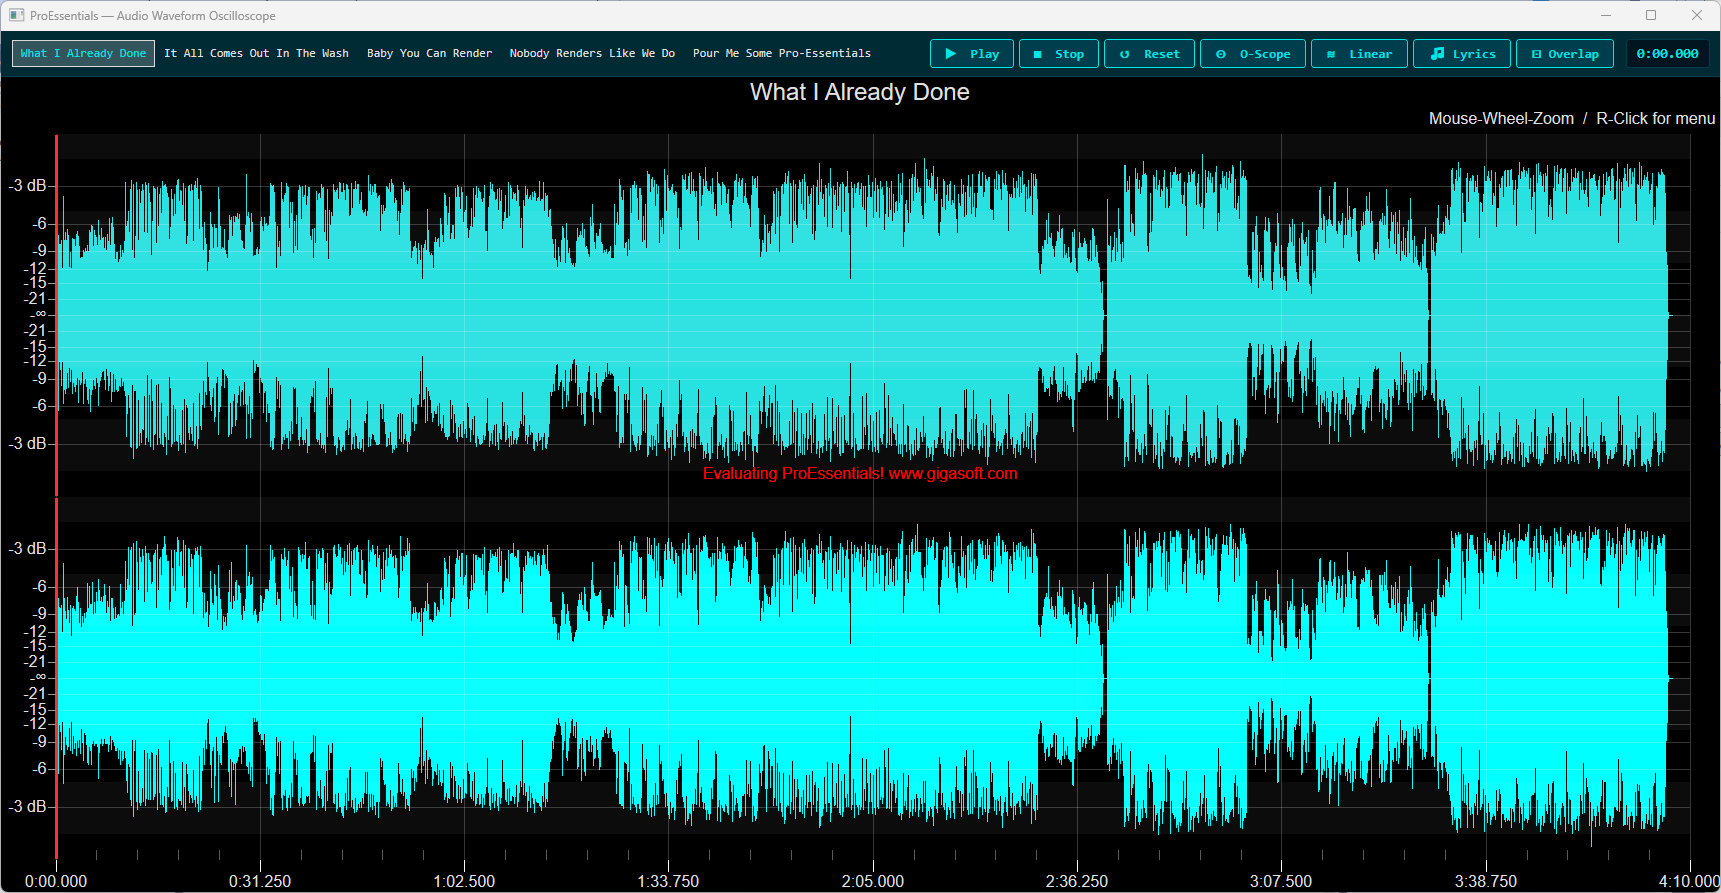 |
Audio Waveform Oscilloscope WPF · WinForms .NET 8 — dual-channel audio oscilloscope with a 5-song playlist, MCI playback, real-time playhead, O-Scope/dBFS/Lyrics/Overlap modes, synchronized lyrics overlay, and a full right-click custom menu. |
Focused C# how-to examples — multi-axis layouts, custom axis labels, log-log scales, mouse interaction and hot spots, bitmap symbols, and a clone-build-run quickstart.
| Preview | Demo |
|---|---|
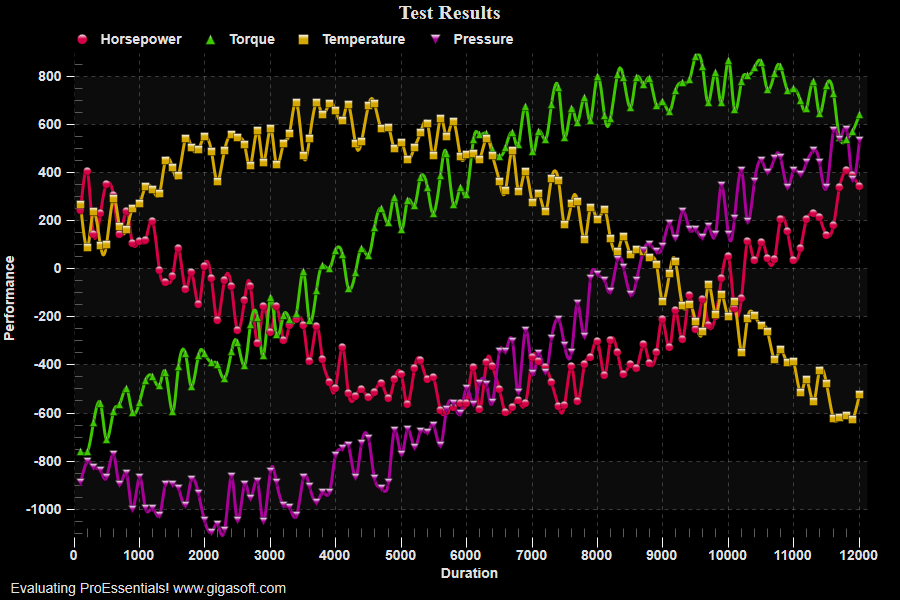 |
Quickstart — Clone, Build, Run WPF · WinForms .NET 8 — the simplest starting point: a single Pesgo scientific chart (Example 100, Simple Scientific Graph) plotting four subsets of random performance data with gradient + bevel plotting, dot grid, zoom/pan, and a tracking tooltip. Direct2D. |
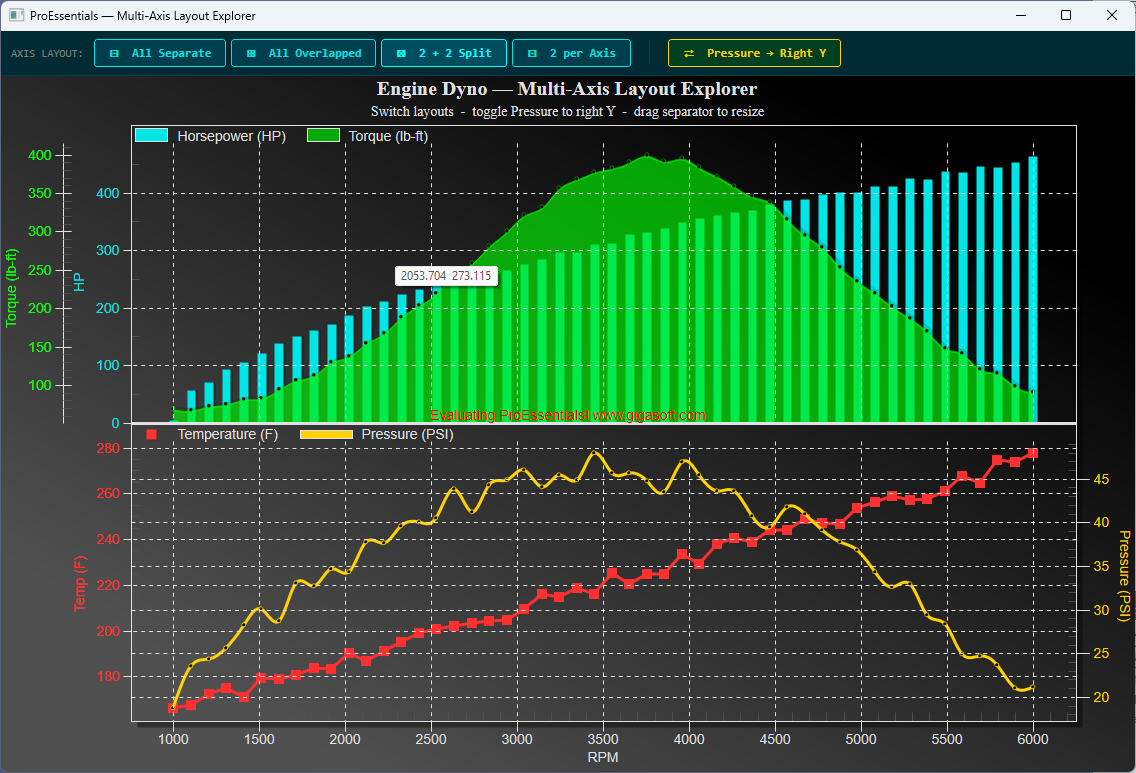 |
Multi-Axis Layout Explorer WPF · WinForms .NET 8 — a single Pesgo scientific chart displaying engine dyno data (HP, Torque, Temperature, Pressure vs RPM) across four instantly switchable axis layout modes, with a toggle that moves Pressure to the right Y axis in whichever layout is active. Mixed plotting methods per subset (Bar, SplineArea, PointsPlusLine, Spline). Direct2D. |
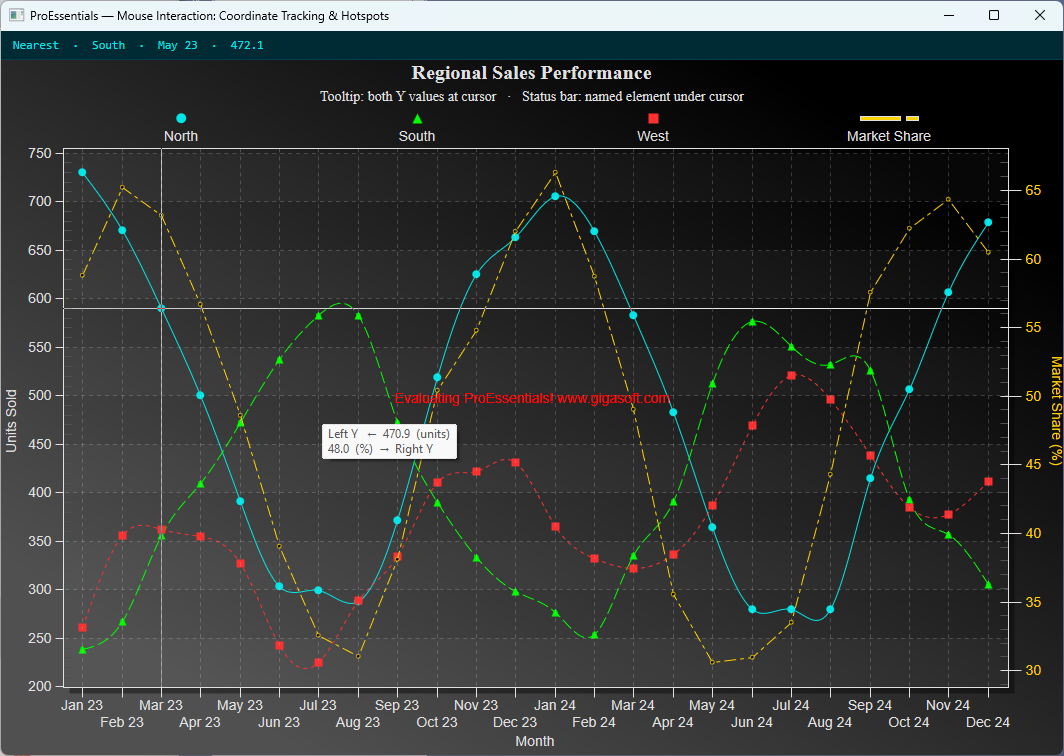 |
Mouse Interaction & Hot Spots WPF · WinForms .NET 8 — a dual-Y-axis Pego chart that combines two complementary mouse-interaction techniques: a ConvPixelToGraph tooltip showing both Y-axis values at the cursor, and a GetHotSpot status bar that names the chart element under the cursor (data point, series legend, or point label). Direct2D. |
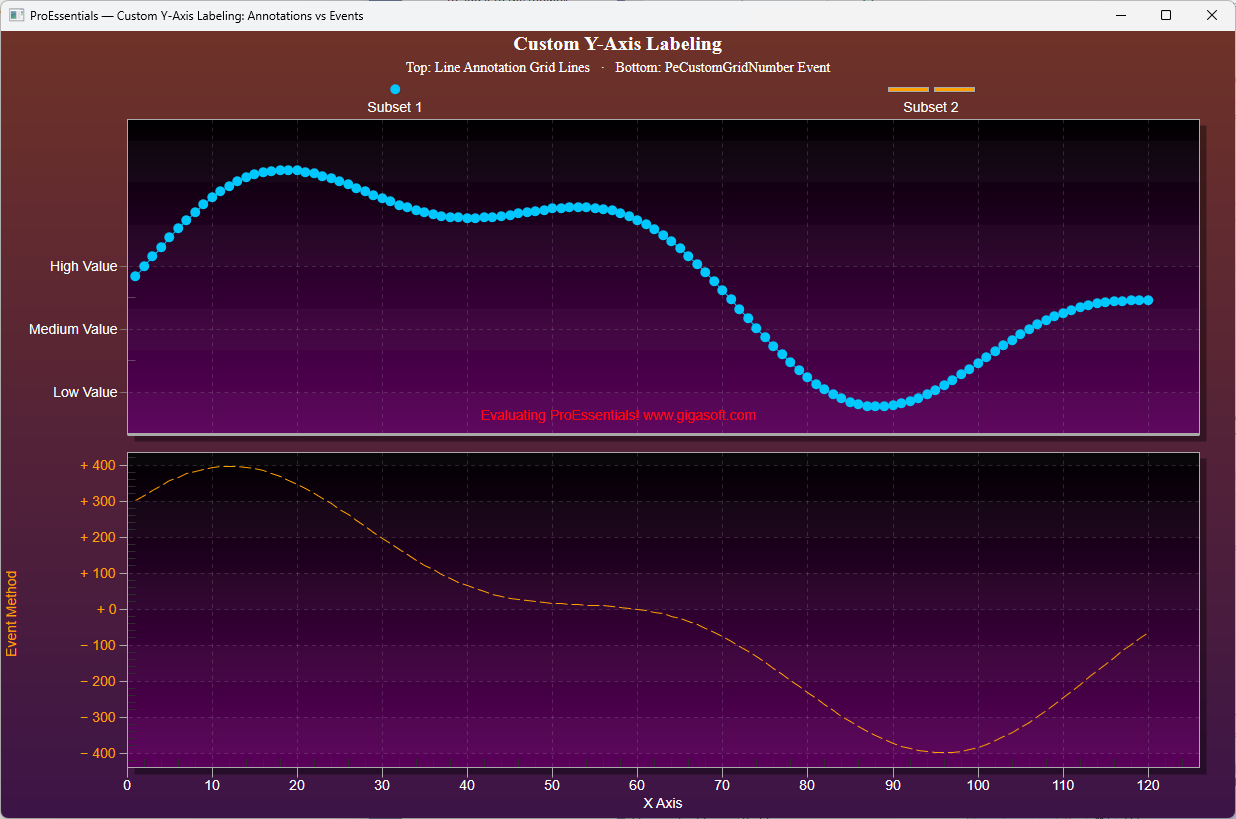 |
Custom Y-Axis Labels & Annotations WPF · WinForms .NET 8 — two approaches to custom Y-axis labels shown side-by-side in one chart split into stacked multi-axis sections. Direct2D. |
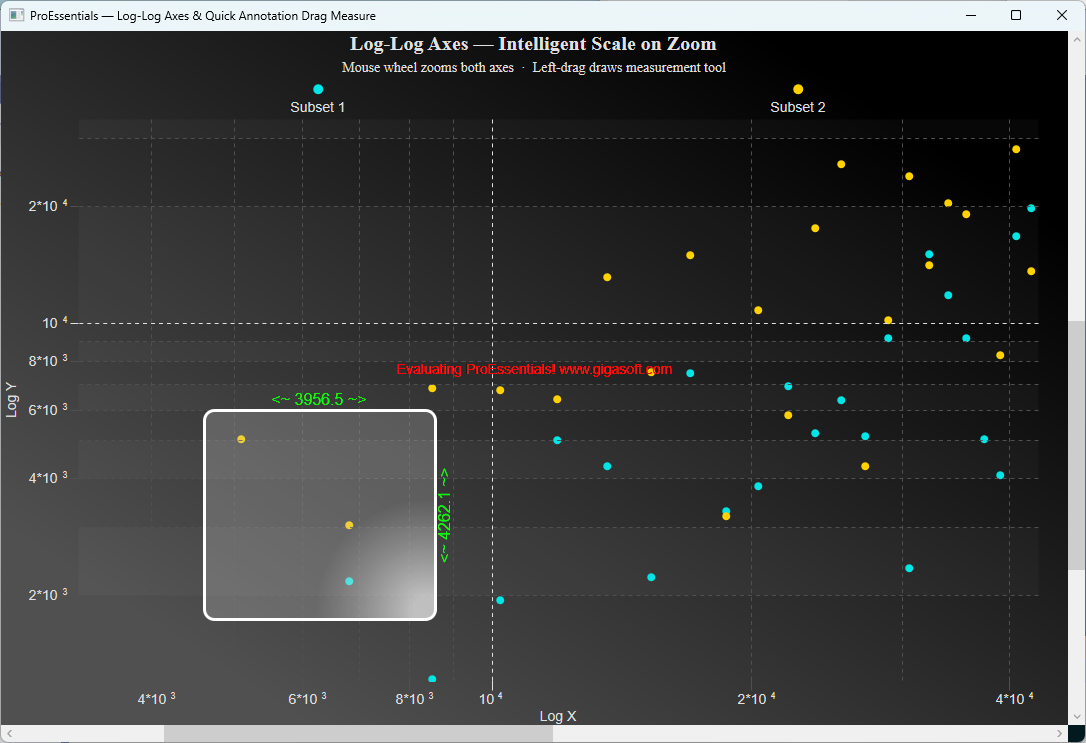 |
Log-Log Axes + Drag-Measure Annotations WPF · WinForms .NET 8 — log-log scientific scatter chart with intelligent decade-based axis restructuring on zoom, plus a left-drag quick annotation measurement tool that overlays a live measurement rectangle with X/Y delta labels. Direct2D. |
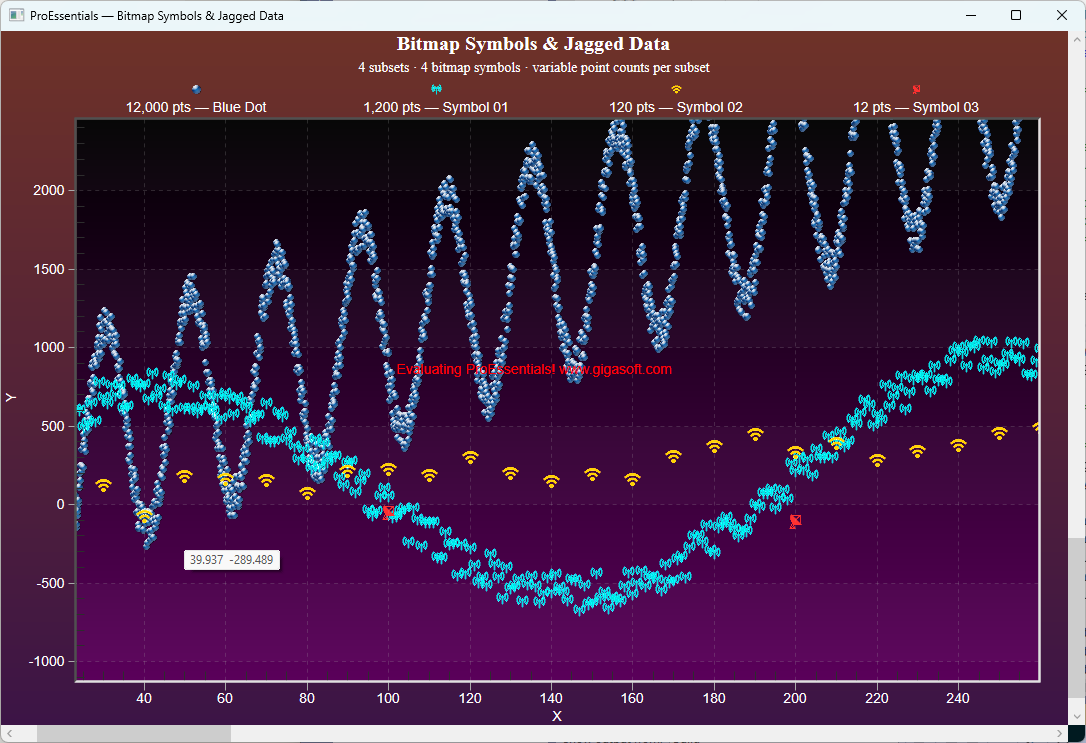 |
Bitmap Symbols + Jagged Data WPF · WinForms .NET 8 — a Pesgo scatter chart combining custom PNG bitmap symbols with jagged data (a different point count per subset). Direct2D. |
➡️ WPF Chart Library Comparison ➡️ Performance — GPU Architecture Comparison ➡️ Licensing & Deployment Pain Comparison ➡️ Plot 100 Million Points — 5-Library Comparison ➡️ 3D Scientific Charts
📦 NuGet | 🌐 gigasoft.com