


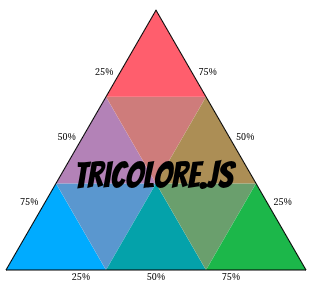
A JavaScript/TypeScript library for visualizing ternary compositions, heavily inspired by the R tricolore package.
Example notebook
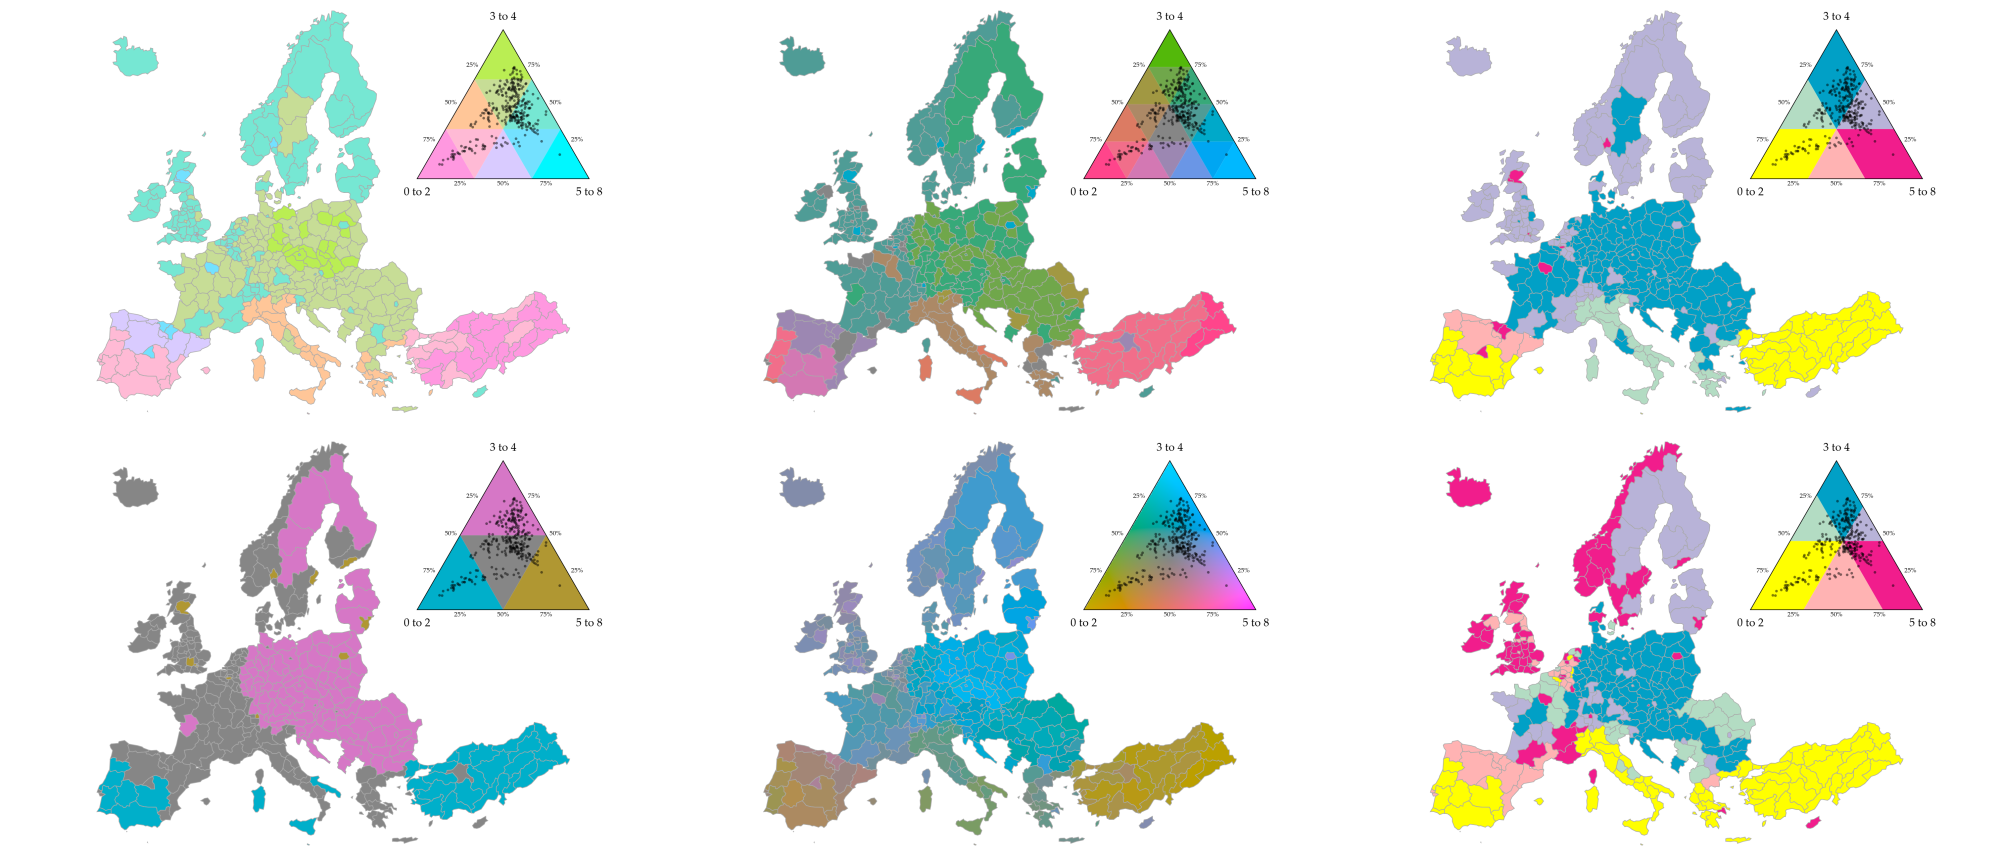
Example notebook (Sextant)
Using Tricolore with geoviz
npm install tricolore # Replace npm by you package manager of choice (yarn, pnpm, ...)import { tricolore } from 'tricolore';
// Create some ternary compositions (p1 + p2 + p3 = 1)
const data = [
[0.7, 0.2, 0.1],
[0.3, 0.6, 0.1],
[0.2, 0.3, 0.5]
];
// Get color codes for each composition
const colors = tricolore(data, {
center: [1/3, 1/3, 1/3], // Center of the color scale
breaks: 3, // Discretization level (use Infinity for continuous)
hue: 80, // Primary hue
chroma: 140, // Color intensity
lightness: 80, // Color lightness
contrast: 0.4, // Contrast between colors
spread: 1 // Spread of colors around center
});
console.log(colors); // An array of hex color codesimport { tricolore, CompositionUtils } from 'tricolore';
// Create some ternary compositions (p1 + p2 + p3 = 1)
const data = [
[0.7, 0.2, 0.1],
[0.3, 0.6, 0.1],
[0.2, 0.3, 0.5]
];
// Compute center
const center = CompositionUtils.center(data);
// Get color codes for each composition
const colors = tricolore(data, {
center: center, // Use the computed center
breaks: Infinity, // Discretization level (Infinity for continuous color scale)
hue: 10, // Primary hue
chroma: 120, // Color intensity
lightness: 70, // Color lightness
contrast: 0.2, // Contrast between colors
spread: 1 // Spread of colors around center
});
console.log(colors); // An array of hex color codesimport { Viz } from 'tricolore';
const dims = {
width: 300,
height: 300,
margin: { top: 10, right: 10, bottom: 10, left: 10 },
};
// Create a continuous ternary plot, returns an SVG element
const p1 = Viz.createContinuousPlot(data, {
hue: 80,
chroma: 140,
lightness: 80,
contrast: 0.4,
spread: 1,
// Whether to show the data points on top of the color scale
showData: true,
// Whether to show the center point
showCenter: true,
// Labels for the three corners
labels: ['Factor 1', 'Factor 2', 'Factor 3'],
// Position of the labels: 'edge' (default), 'corner'
labelPosition: 'corner',
// Whether to rotate the tick labels for better readability
rotateTickLabels: false,
}, dims);
// Create a discrete ternary plot, returns an SVG element
const p2 = Viz.createDiscretePlot(data, {
hue: 80,
chroma: 140,
lightness: 80,
contrast: 0.4,
spread: 1,
breaks: 3,
showData: true,
labelPosition: 'edge',
}, dims);
// Create a sextant ternary plot, returns an SVG element
const p3 = Viz.createSextantPlot(data, {
values: ['#FFFF00', '#B3DCC3', '#01A0C6', '#B8B3D8', '#F11D8C', '#FFB3B3'],
showData: true,
labelPosition: 'edge',
rotateTickLabels: true,
}, dims);Note that this example uses D3.js for the sake of simplicity, but it's not a requirement.
import { tricolore } from 'tricolore';
import * as d3 from 'd3';

// Assuming you have GeoJSON with ternary data
d3.json('regions.json').then((geojson) => {
  // Extract compositions from properties
  const data = geojson.features.map((f) =>
    [f.properties.var1, f.properties.var2, f.properties.var3]
  );

  // Get colors
  const colors = tricolore(data);

  // Create map
  const svg = d3.select('#map')
    .append('svg')
    .attr('width', 800)
    .attr('height', 500);

  const projection = d3.geoMercator().fitSize([800, 500], geojson);
  const path = d3.geoPath().projection(projection);

  svg.selectAll('path')
    .data(geojson.features)
    .enter()
    .append('path')
    .attr('d', path)
    .attr('fill', (d, i) => colors[i]); // Use the computed colors
});Hue: Defines the hue of the first component (p1 - left corner). The hues of the other two components are automatically set to +120° (for p2 - top corner) and +240° (for p3 - right corner) on the color wheel, forming a triadic scheme.
Chroma: Controls the maximum saturation/intensity of the pure colors at the corners of the triangle. The higher this value, the more vivid and distinct the colors.
Lightness: Determines the overall brightness of the palette. Affects all colors in the triangle.
Contrast: Controls the difference in brightness and saturation between the center (balanced mix) and the corners (pure components). Higher contrast makes the corners more distinct from the center.
Spread: Controls the extent of the color gradient around the center. A higher value concentrates color differentiation near the center.
See the full documentation for detailed API reference.
GPL-3.0 License. See the LICENSE file for details.