-
Notifications
You must be signed in to change notification settings - Fork 0
Expand file tree
/
Copy pathindex.html
More file actions
170 lines (138 loc) · 4.56 KB
/
Copy pathindex.html
File metadata and controls
170 lines (138 loc) · 4.56 KB
1
2
3
4
5
6
7
8
9
10
11
12
13
14
15
16
17
18
19
20
21
22
23
24
25
26
27
28
29
30
31
32
33
34
35
36
37
38
39
40
41
42
43
44
45
46
47
48
49
50
51
52
53
54
55
56
57
58
59
60
61
62
63
64
65
66
67
68
69
70
71
72
73
74
75
76
77
78
79
80
81
82
83
84
85
86
87
88
89
90
91
92
93
94
95
96
97
98
99
100
101
102
103
104
105
106
107
108
109
110
111
112
113
114
115
116
117
118
119
120
121
122
123
124
125
126
127
128
129
130
131
132
133
134
135
136
137
138
139
140
141
142
143
144
145
146
147
148
149
150
151
152
153
154
155
156
157
158
159
160
161
162
163
164
165
166
167
168
169
170
<!DOCTYPE html>
<html>
<head>
<title>Introduction to Stuff</title>
<meta http-equiv="Content-Type" content="text/html; charset=UTF-8"/>
<style type="text/css">
@import url(https://fonts.googleapis.com/css?family=Yanone+Kaffeesatz);
@import url(https://fonts.googleapis.com/css?family=Droid+Serif:400,700,400italic);
@import url(https://fonts.googleapis.com/css?family=Ubuntu+Mono:400,700,400italic);
body { font-family: 'Droid Serif'; }
h1 {
font-family: 'Yanone Kaffeesatz';
font-weight: normal;
color:darkslategrey;
}
h2, h3 {
font-family: 'Yanone Kaffeesatz';
font-weight: normal;
}
.font40 {
font-size: 40px;
}
.font30 {
font-size: 30px;
}
.font20 {
font-size: 20px;
}
.remark-code, .remark-inline-code {
font-family: 'Ubuntu Mono';
font-size: 20px;
}
/* Two-column layout */
.left-column {
color: #777;
width: 50%;
float: left;
}
.left-column h2:last-of-type, .left-column h3:last-child {
color: #000;
}
.right-column {
width: 50%;
float: right;
padding-top: 1em;
}
.right-column h2:last-of-type, .right-column h3:last-child {
color: #000;
}
.inverse {
background: #272822;
color: #e4e4e1;
text-shadow: 0 0 20px #333;
}
.inverse h1, .inverse h2, .inverse h3 {
color: #f3f3f3;
line-height: 0.8em;
}
.lightfont {color:rgb(129, 126, 126);
</style>
</head>
<body>
<textarea id="source">
class: center, middle, font30
# Introduction to Slides
J. Hathaway
---
class: font30
# Disclaimers
What you claim
???
- Notes for the slide
---
class: font20
# Introduction to Data Visualization
Our eyes are drawn to [colors and patterns](https://www.tableau.com/learn/whitepapers/tableau-visual-guidebook). We can quickly identify red from blue, and squares from circles. Our culture is visual, including everything from art and advertisements to TV and movies. Data visualization is another form of visual art that grabs our interest and keeps our eyes on the message.
.left-column[
### Advantages of data visualization:
- Easily sharing information.
- Interactively explore opportunities.
- Visualize patterns and relationships.
]
.right-column[
### Disadvantages:
- Biased or inaccurate information.
- Correlation doesn’t always mean causation.
- Core messages can get lost in translation.
]
[Tableau Reference](https://www.tableau.com/learn/articles/data-visualization)
---
class: font20
# Introduction to __Plotly__ for Data Visualization
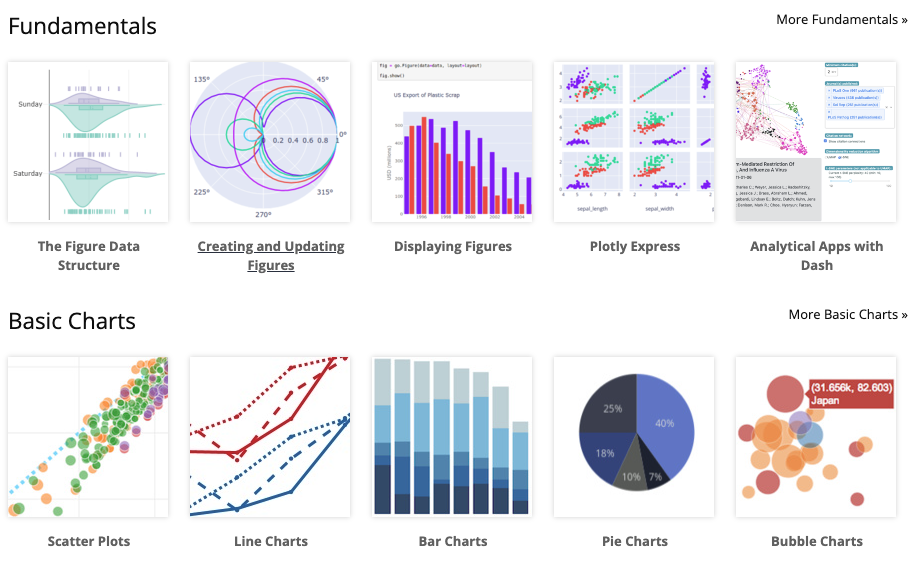
The Plotly Python package leverages the plotly.js JavaScript library to enables Python users to create beautiful interactive web-based visualizations. Plotly.js is built on top of d3.js and stack.gl, Plotly.js is a high-level, declarative charting library. plotly.js ships with over 40 chart types, including 3D charts, statistical graphs, and SVG maps.
---
class: font30
# Plotly programming
Now let's practice using Plotly with our installation of Python
1. Plotly practice (03_begin_plotly.py)
2. Data visualization with our munged data (03_explore.py)
```python
import plotly.express as px
df = px.data.iris() # iris is a pandas DataFrame
fig = px.scatter(df, x="sepal_width", y="sepal_length")
fig.show()
```
```python
import plotly.express as px
df = px.data.gapminder().query("continent == 'Oceania'")
fig = px.line(df, x='year', y='lifeExp', color='country', markers=True)
fig.show()
```
---
</textarea>
<script src="https://remarkjs.com/downloads/remark-latest.min.js" type="text/javascript">
</script>
<script type="text/javascript">
remark.macros.upper = function () {
// `this` is the value in the parenthesis, or undefined if left out
return this.toUpperCase();
};
remark.macros.random = function () {
// params are passed as function arguments: ["one", "of", "these", "words"]
var i = Math.floor(Math.random() * arguments.length);
return arguments[i];
};
remark.macros.scale = function (percentage) {
var url = this;
return '<img src="' + url + '" style="width: ' + percentage + '" />';
};
var slideshow = remark.create({
ratio: "16:9",
highlightLanguage: 'javascript',
highlightStyle: 'monokai'
});
</script>
</body>
</html>